Getting Started with Relyence Weibull
If you would like to review a video overview of this Getting Started Guide, go to our online videos for Relyence Weibull.
1. Sign in to Relyence
To begin, make sure you are signed in to Relyence. For details on signing in, see Signing in and Signing out.
You must have a Relyence account to sign in to Relyence. If you do not yet have a Relyence account, you can register for one for free.
You may possibly see the Announcements dialog when first signing into Relyence. The Announcements automatically scroll, or you can review them using the previous and next arrow keys. For any Announcements you do not wish to see again, select the Don't show me this again checkbox. Once you have reviewed all the Announcements, click the 'x' (Close) button in the upper right corner of the Announcements dialog.
2. Open the Example Analysis
First, let's make sure Relyence Weibull is active.
After you have signed in, you may see a Welcome dialog. If a Welcome dialog does not appear, click Welcome to Relyence from the Help dropdown menu in the upper right of the Relyence header bar.
If you were previously working on an Analysis, you will see the Continue Where I Left Off option at the top of this dialog, otherwise it will not appear. If you are using a Trial version, the Show this page when Relyence opens option will not appear. This option is only available using a licensed version of Relyence.
Click the Weibull tab on the left to activate Relyence Weibull. Then click Open Example Analysis.
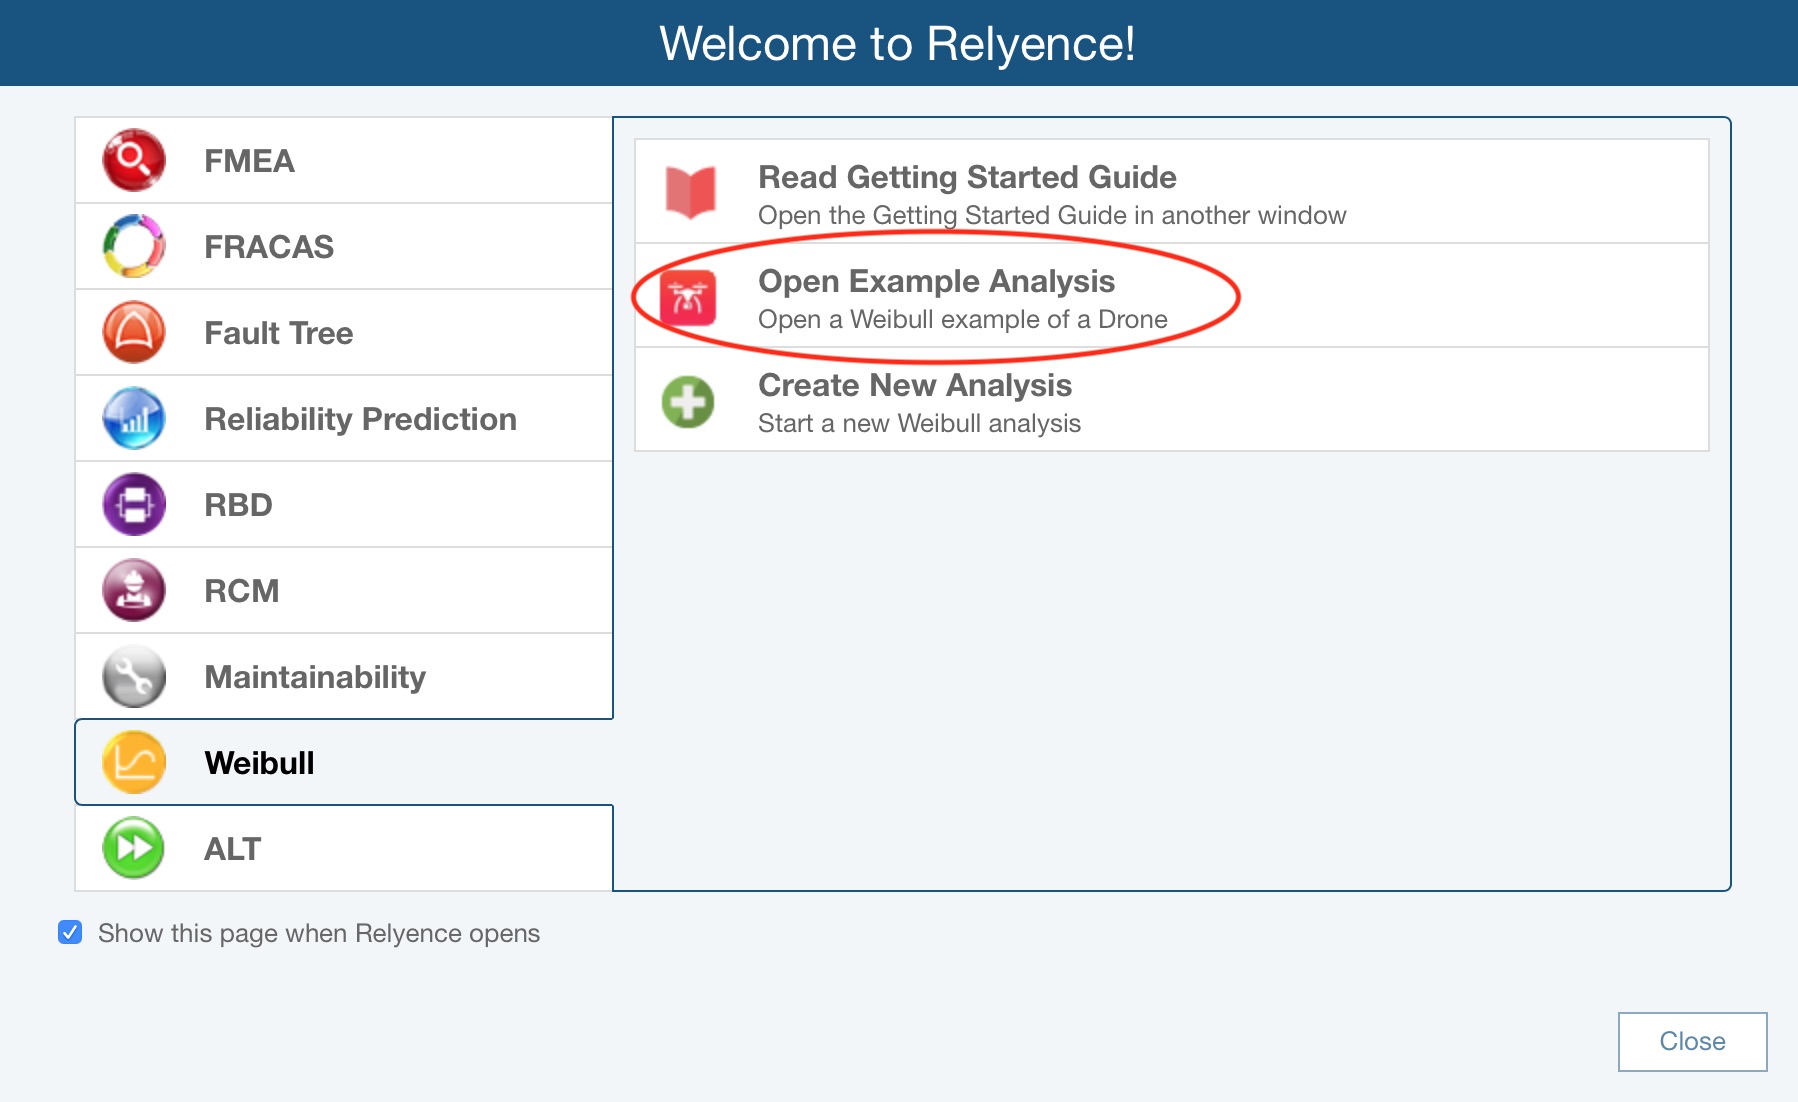
For this tutorial, we will use the Drone Example supplied with Relyence Weibull and its sample Life Data set.
In addition to Life Data analysis, Relyence Weibull also supports Reliability Growth Analysis; however, Reliability Growth Analysis will not be covered in this tutorial. Reliability Growth Analysis with Relyence Weibull is explained in various topics in the Relyence Weibull Basics and Relyence Weibull Advanced Features sections of this guide.
When you open Relyence Weibull for the first time, you will see two pop up messages: the Revert Example message and the Calculate message.
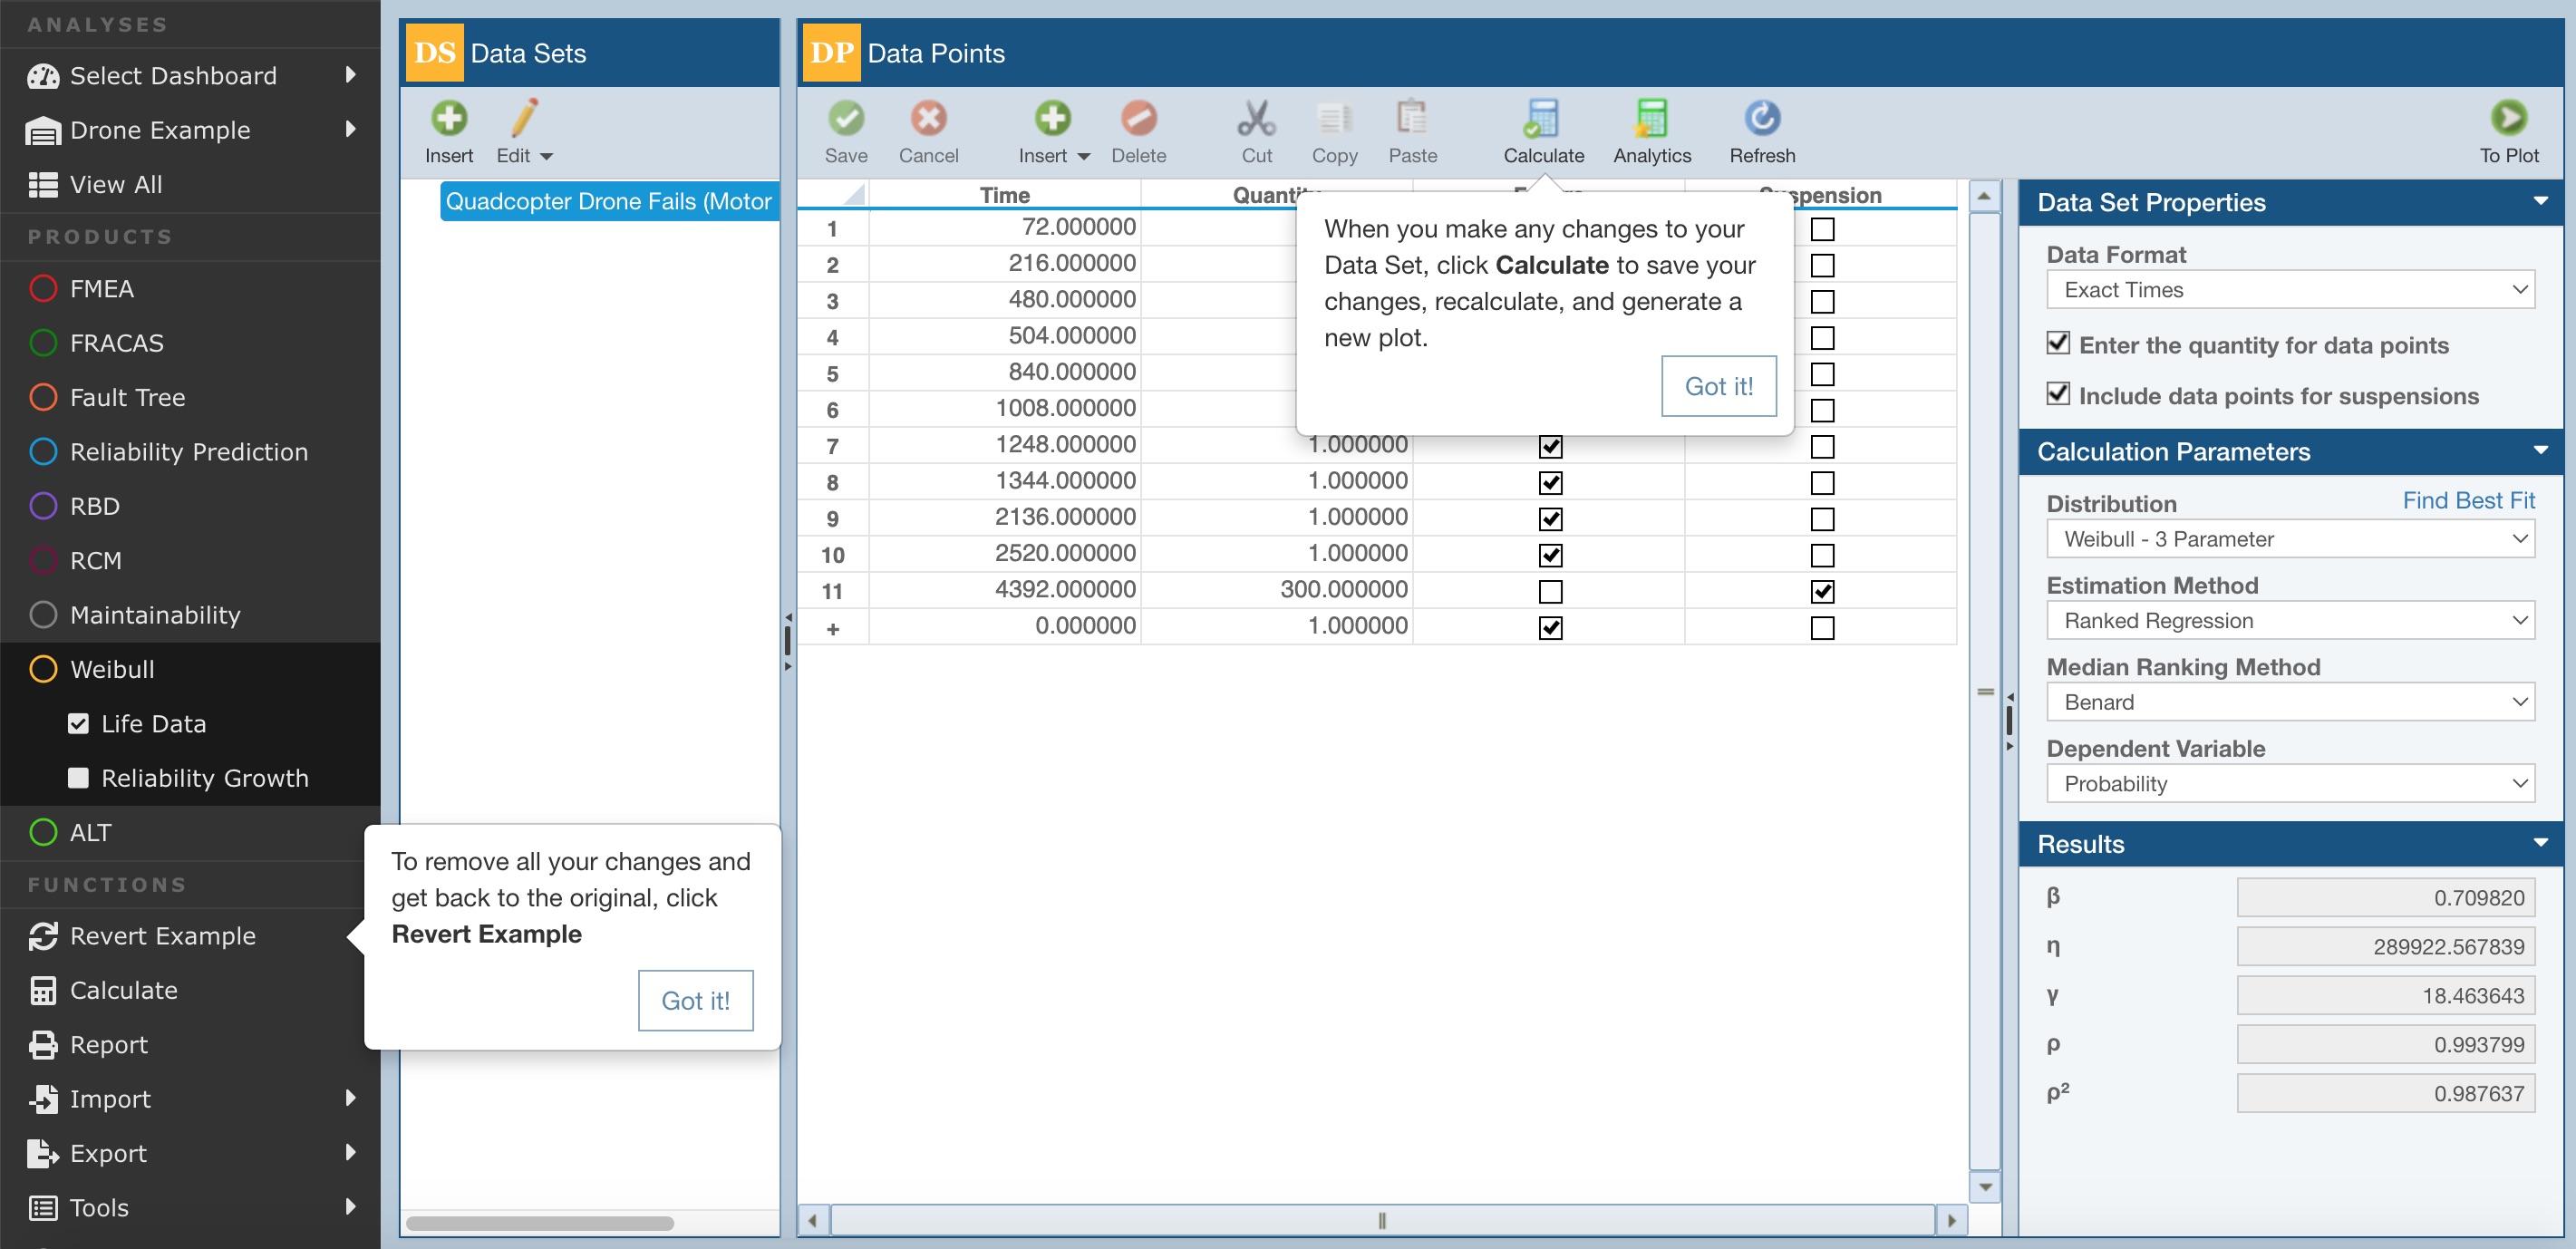
You are free to make changes and save them to the Example Analysis. If you want to revert to the original Example at any time, you can click Revert Example from the Sidebar menu. You will get a message asking if you are sure before your changes are discarded. The Revert Example pop up message is a reminder of the revert process and highlights the Revert Example function in the Sidebar for you.
Click Got it! to dismiss the Revert Example pop up message.
When using Relyence Weibull, any time you make a change to your Weibull Data Set, Data Set Properties, or Calculation Parameters, you will need to recalculate to view the new results and new Weibull Plot. Clicking the Calculate button on the Weibull toolbar - highlighted by the Calculate pop up message - is an easy way to do this. Any time you create a new Weibull Analysis, the Calculate pop up will appear as a reminder.
Click Got it! to dismiss the Calculate pop up message.
For this tutorial, we assume an unmodified original Example is being used. If you are not sure if you are using an unmodified version of the Example, click Revert Example from the Sidebar. You will be asked if you want to lose your changes and reopen the Example in its original version. Click Yes. Click Got it! to dismiss the pop up messages.
If you continue with a modified version, just be aware that screen shots or other functions may not operate exactly as described in this tutorial.
When complete, your Drone Example with its data will appear in the main window.
3. Review the Data Sets, Data Points, and Properties panes
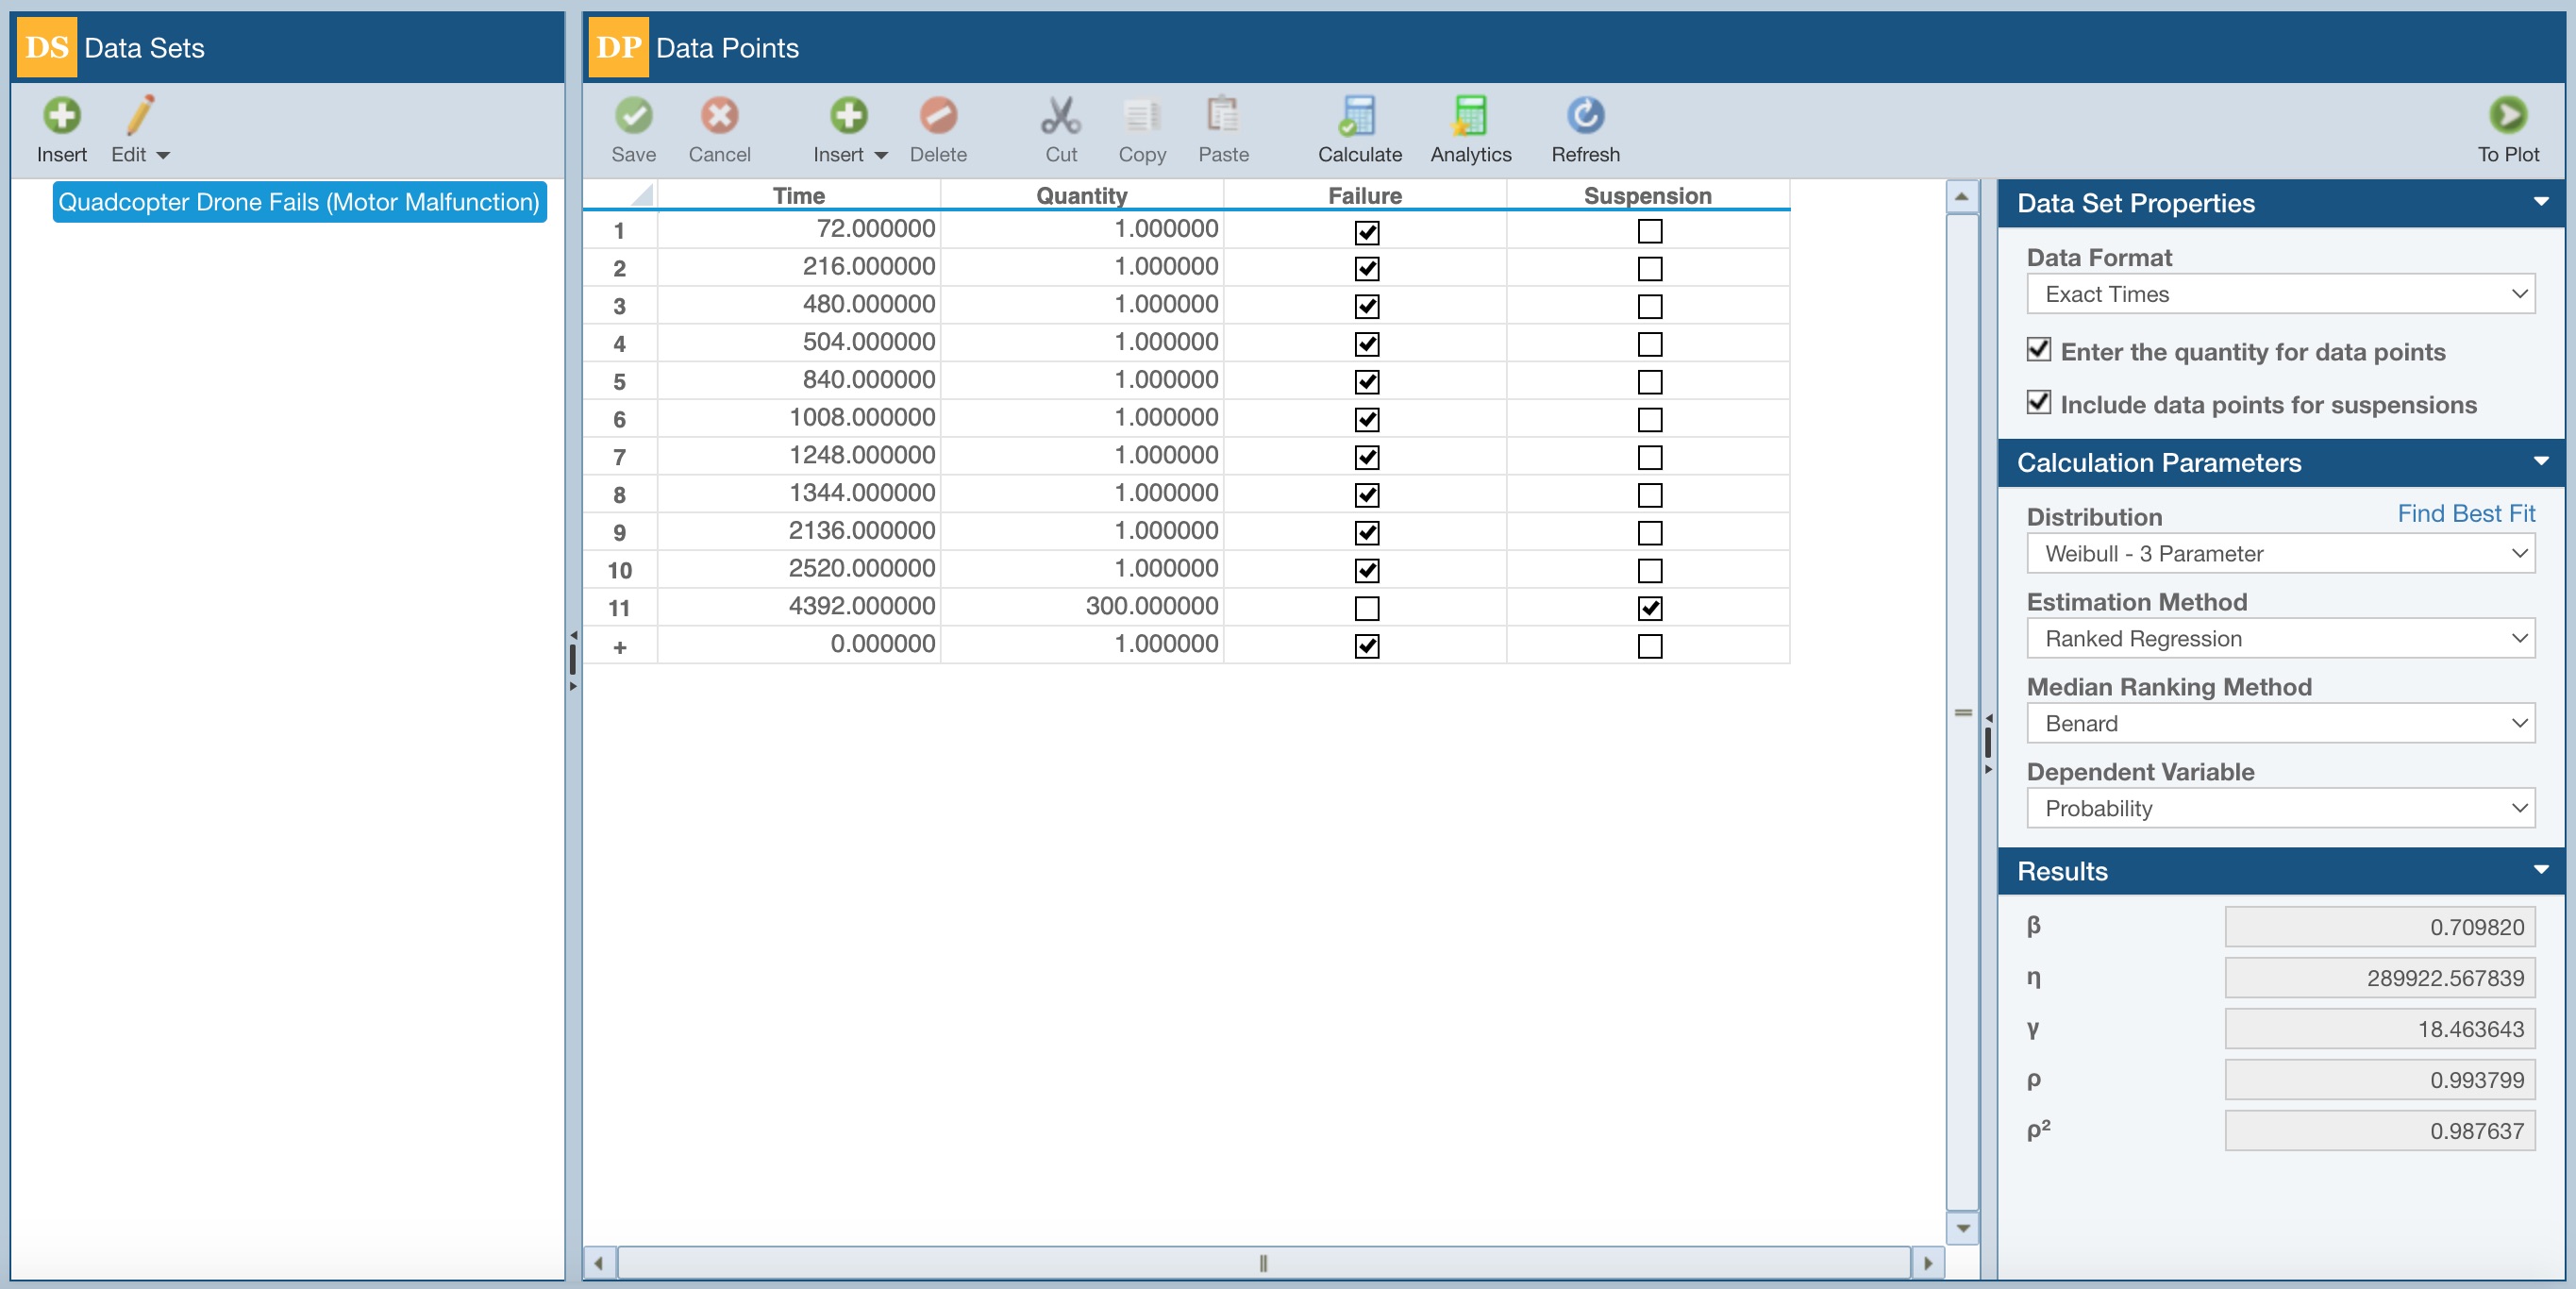
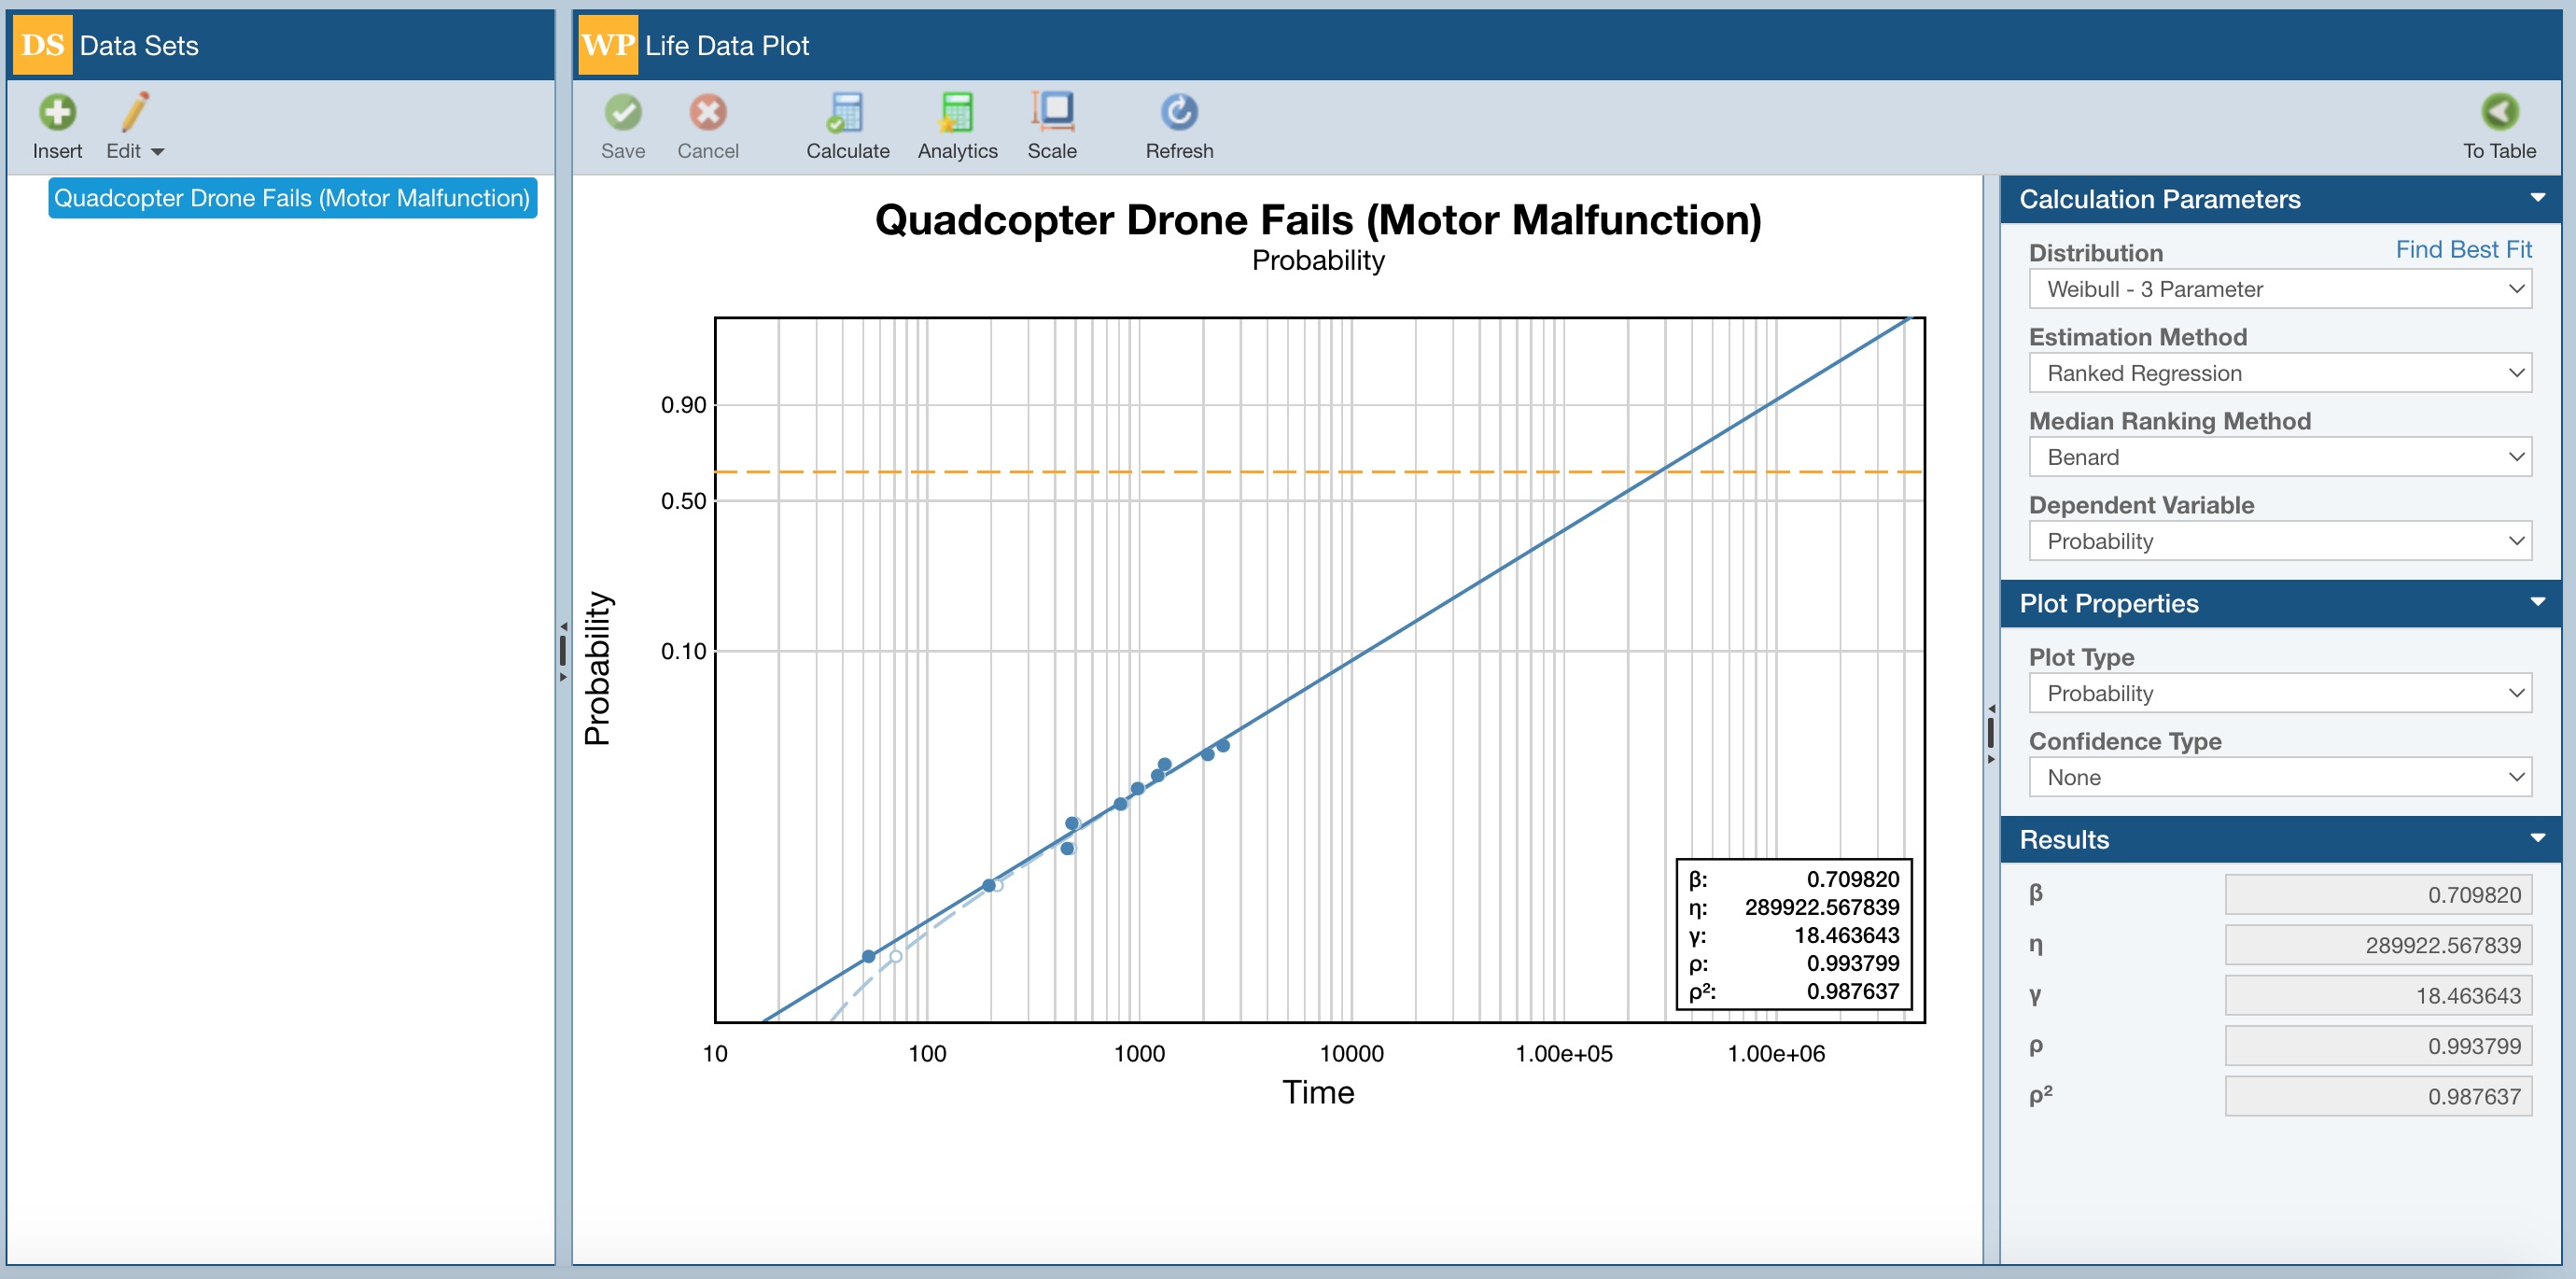
There are three parts to the main Weibull window. The leftmost pane, Data Sets, displays the listing of all your Weibull Data Sets. In the Drone Example, there is only a single Data Set "Quadcopter Drone Fails (Motor Malfunction)".
In the center is the Data Points Table. The Data Points Table is a list of all the data points associated with the Data Set selected in the Data Sets pane.
The rightmost Properties pane has three sections: the Data Set Properties, the Calculation Parameters, and the Results.
The Data Set Properties section allows you to configure the Data Points Table to match the type of data you have. To see how the Data Point Table changes with modifications to the Data Set Parameters, clear the Enter the quantity for data points checkbox by clicking it. Notice that the Data Points Table no longer displays the Quantity column.
Also, notice that a red indicator appears in the upper corner of the Enter the quantity for data points checkbox. Any time you make any changes to the data in the Properties pane, the red indicator will appear as a visual reminder that changes have been made but have not yet been saved. Once changes are saved or canceled, the red indicators will no longer appear.
To revert back to the original setting, click the Cancel button in the toolbar, and then click Yes to the "Do you want to discard your changes?" message.
The Calculation Parameters section is where you define the parameters you wish to use when performing Weibull calculations.
Lastly, the Results section displays the resulting calculation parameters of the Data Set after Weibull calculations have been performed. The parameters that appear vary depending on the selected Distribution in the Calculation Parameters section. The Results section is for viewing purposes only; therefore, it is disabled.
4. Review the Weibull Plot
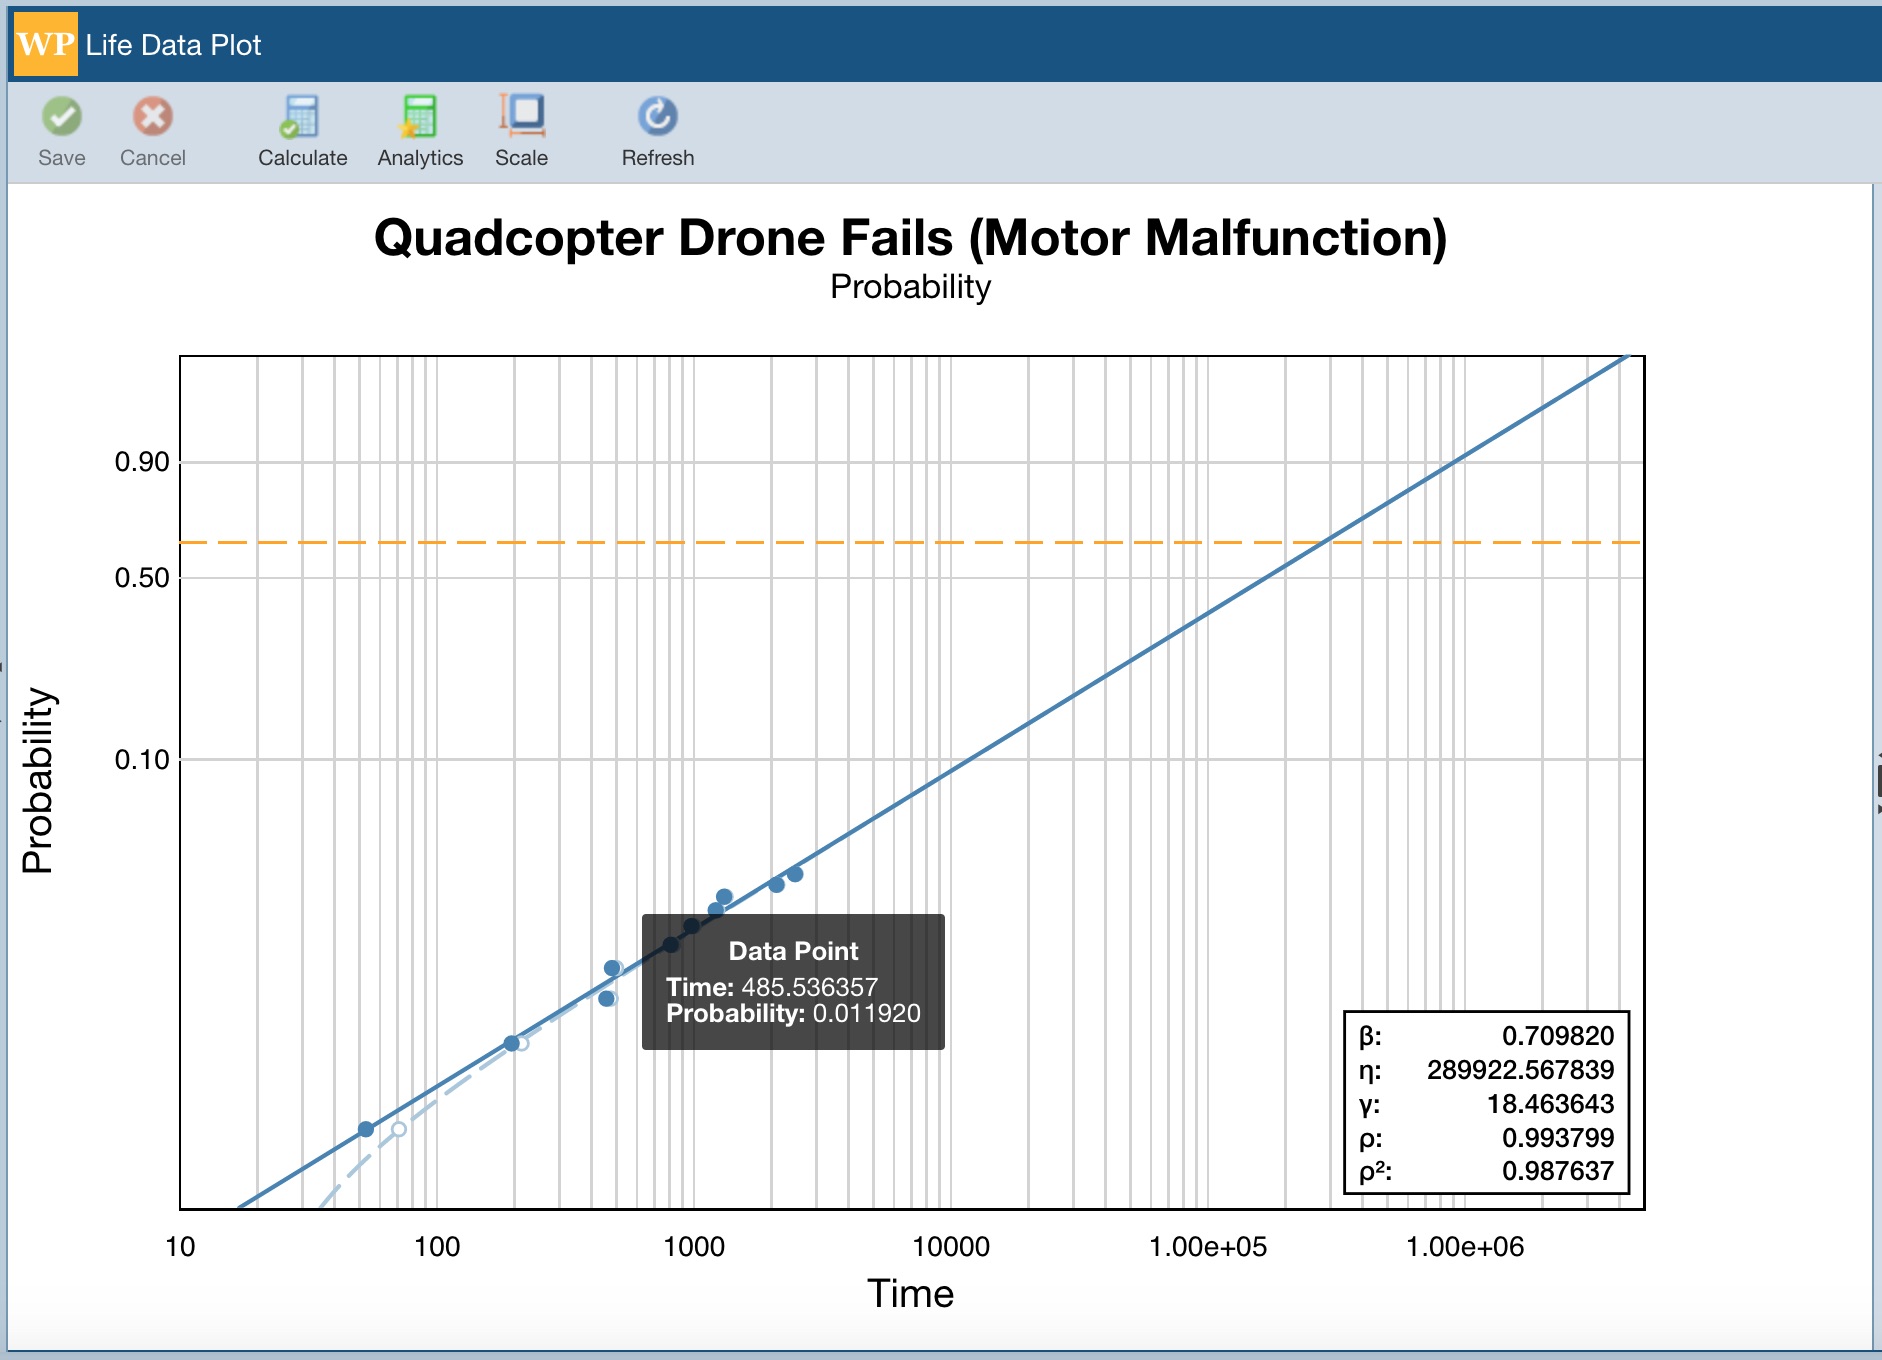
Click the To Plot button in the top right section of the Weibull toolbar.
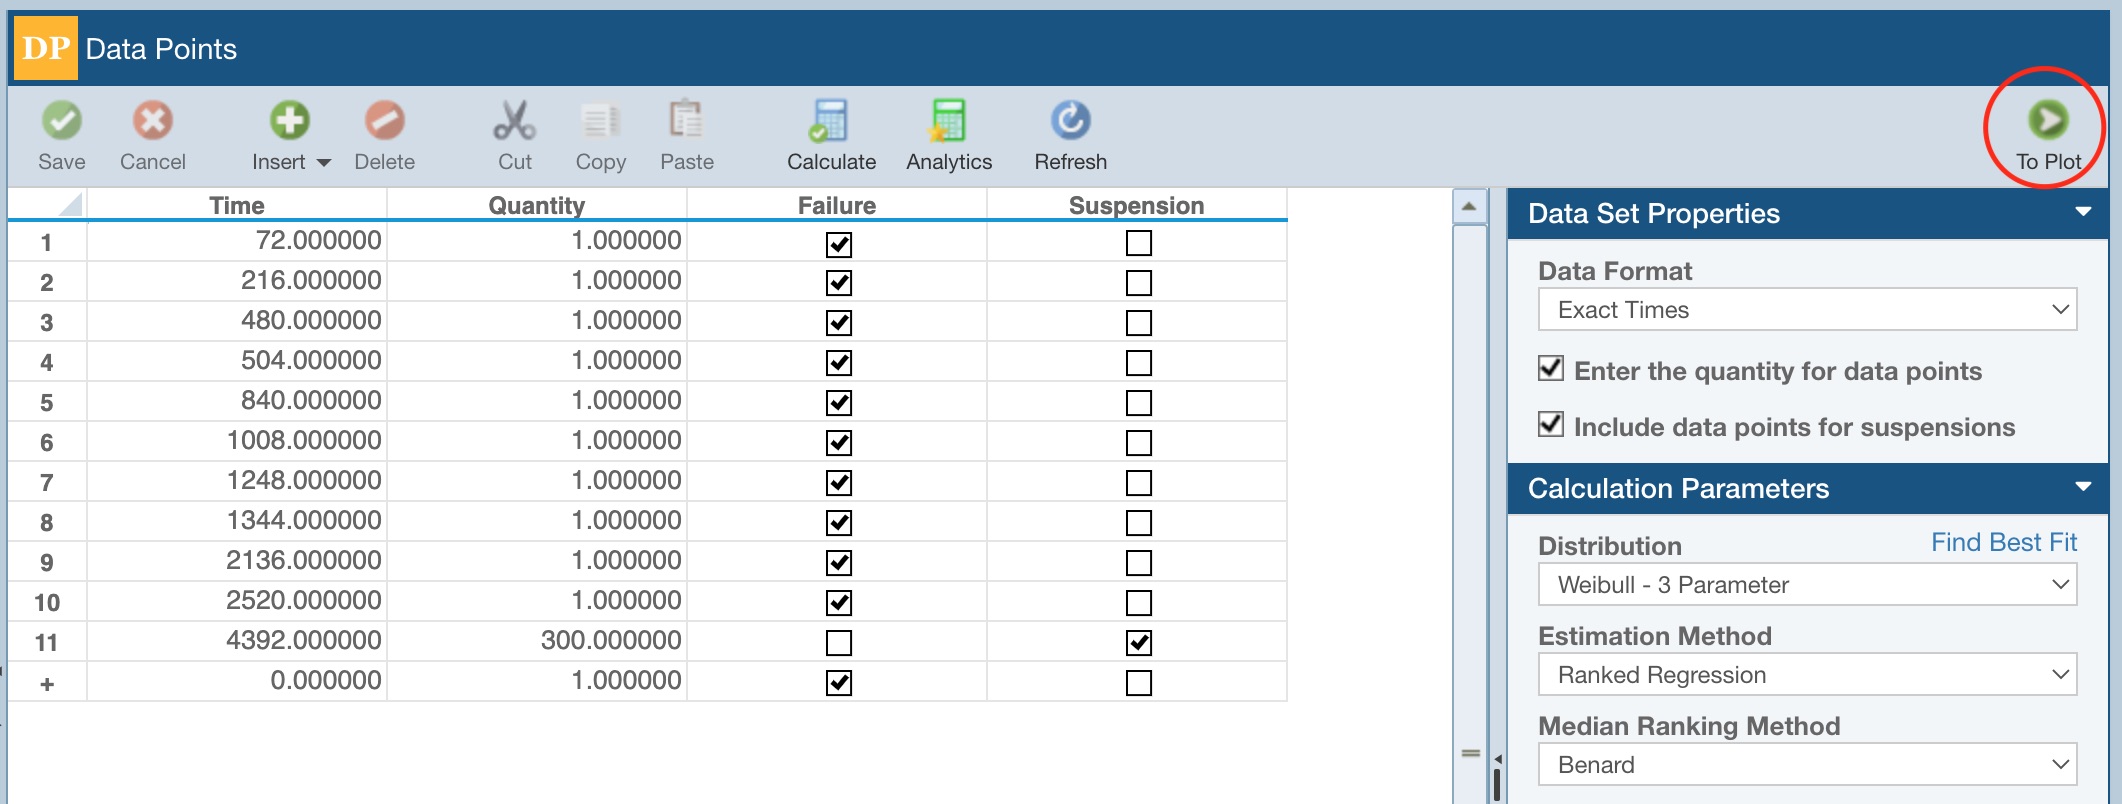
The center pane is now replaced with the Weibull plot. The Weibull plot displays the data points along with the curve fit of the data.
Hover over any one of the data points along the curve and you will see a tooltip with the data point information.
5. Report
Once you have completed data entry and calculation, you may want to generate a report of your Weibull plot. To do this, click Report from the Sidebar. A new browser tab will open with a preview of your Weibull plot in a report format.
.jpg)
You can print reports, or export them in a JPG, BMP, PNG, or SVG format.
Close the Report browser tab when you are done viewing the report.
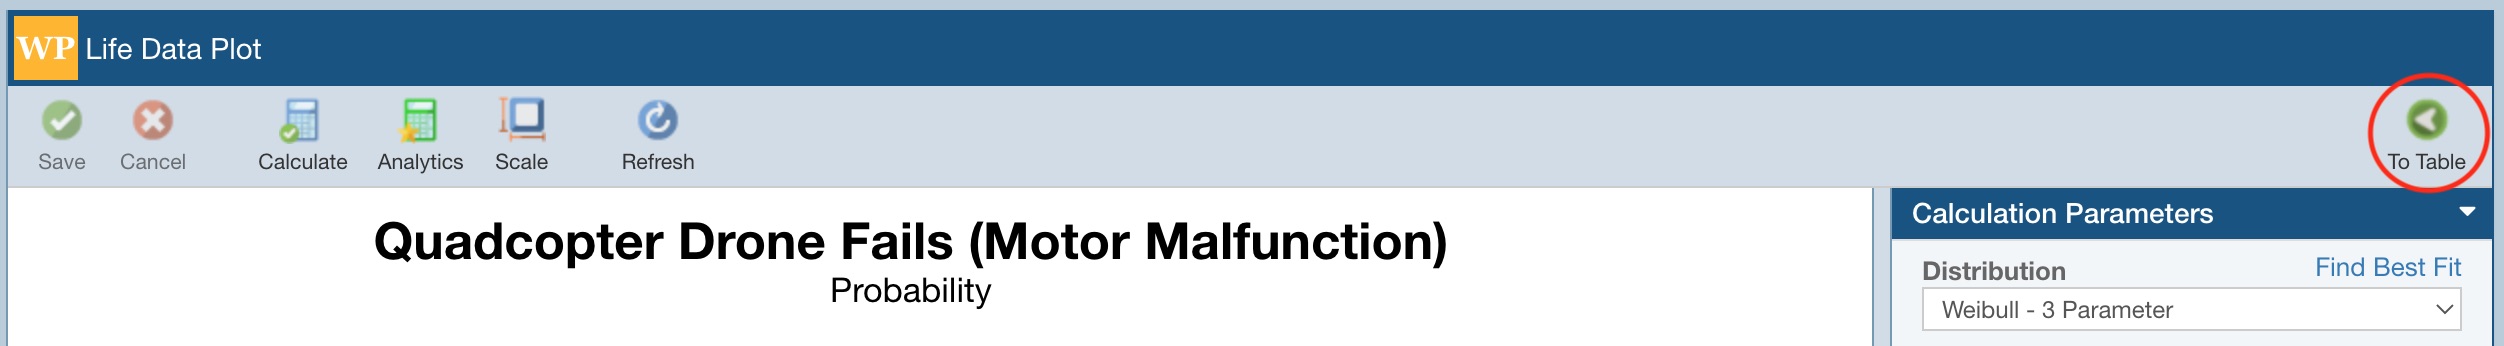
You may also want to create a report of your Weibull input data. To do this, first click the To Table toolbar button to return to the Data Points Table.
Click Report from the Sidebar menu.
The Report Options dialog appears.
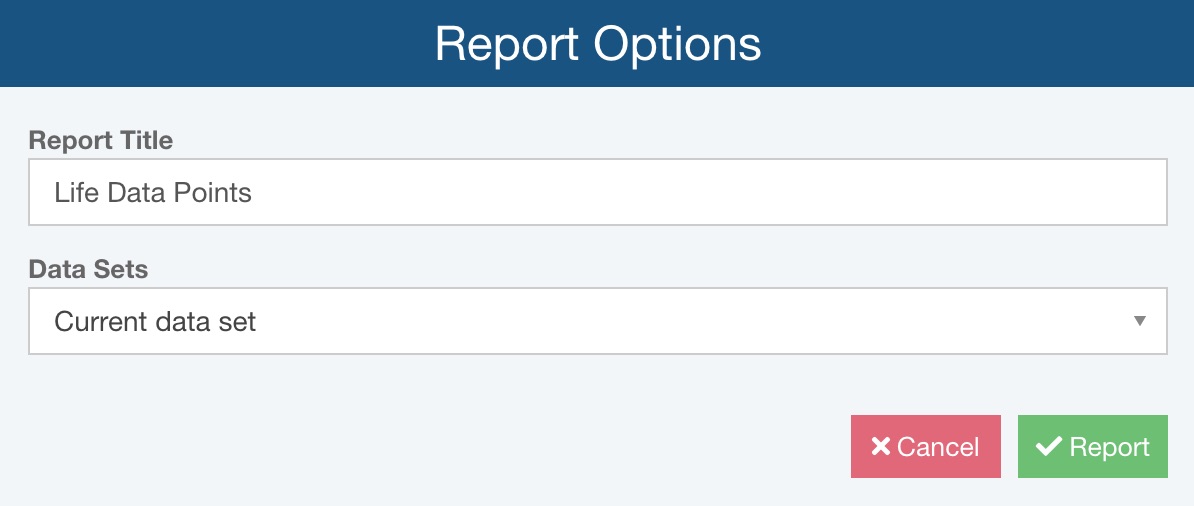
Make sure the Report Title is set to "Life Data Points" and the Data Sets field has Current data set selected. Click the Report button to generate the report.
The report appears in a new browser tab.
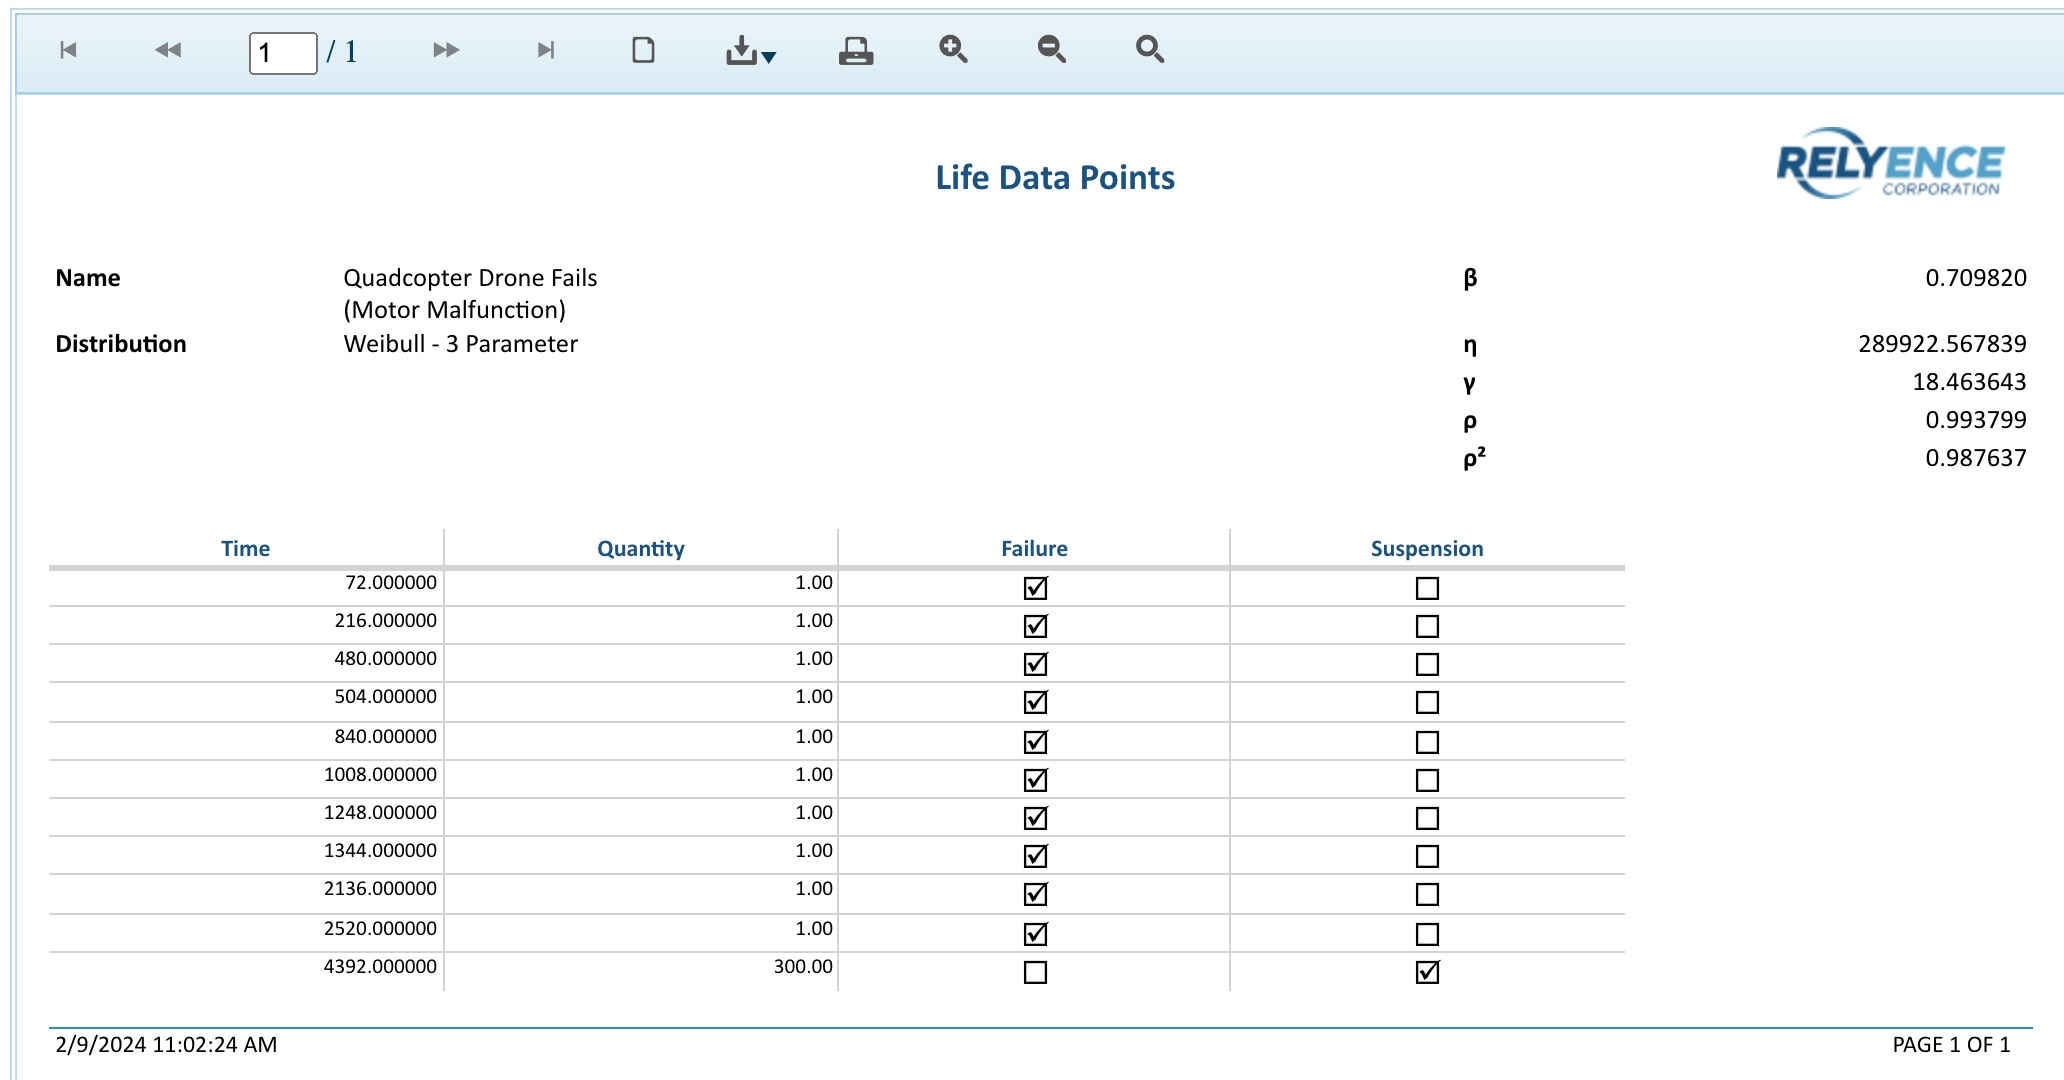
You can print reports, or save them in a PDF, Excel, PowerPoint, TIFF, or Word format.
Close the Report browser tab when you are done viewing the report.
6. Add a Data Set
Now, let's add a new Data Set and perform Life Data analysis.
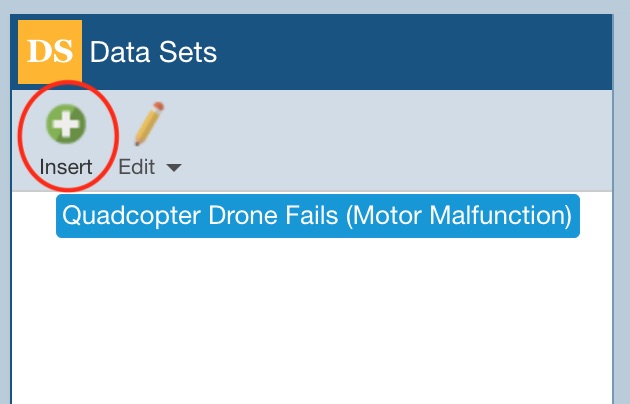
In the Data Sets pane toolbar, click Insert.
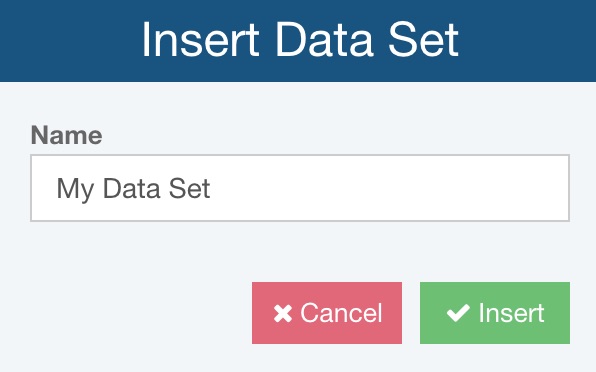
The Insert Data Set dialog appears. Enter "My Data Set" for the Name of the new Data Set. Click the Insert button to add the new Data Set.
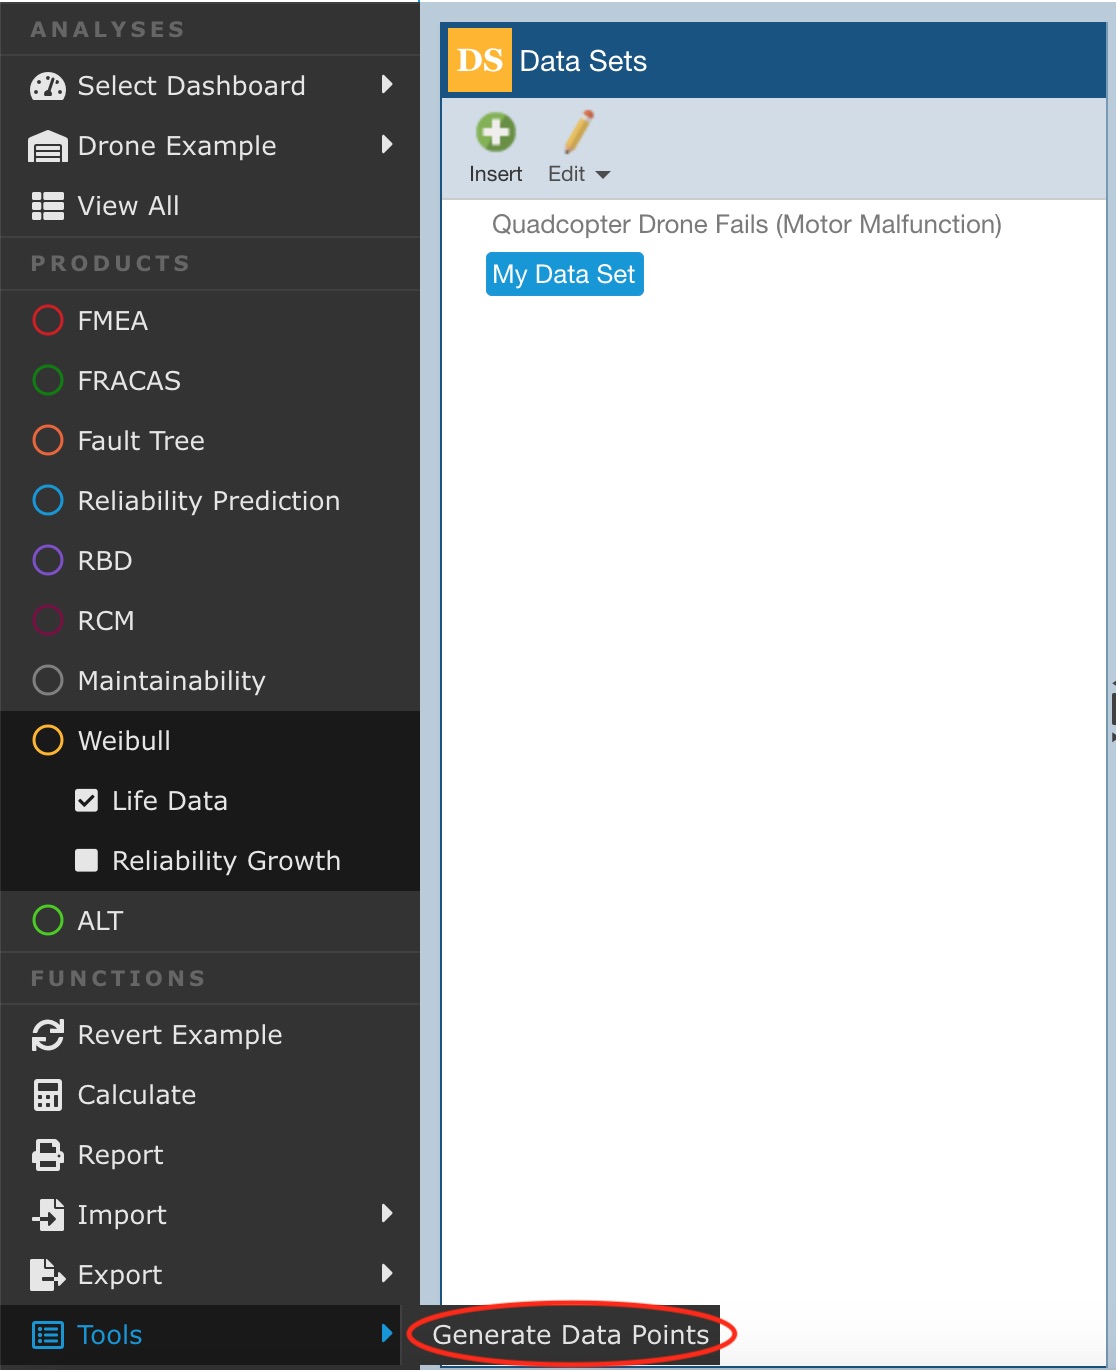
For this example, we are going to generate a random set of numerical values to use for our Data Set. Relyence has a tool to make this easy. From the Sidebar, click Tools>Generate Data Points to create a Data Set. This feature is available for some quick and easy testing if you don't have real failure data available; it is not intended to be used for any other purpose.
Otherwise, Data Set data points can be entered manually, by copying from Excel or via importing from Excel. Also note that on the Data Points Table in Relyence Weibull, keyboard support for Insert is supported using the <Insert> key and <Ctrl>+<Shift>+<NumPad +>.
The Generate Random Data Points dialog appears. Enter "25" for the Number of Points, leave the default value for beta at 1.5, and eta at 10.
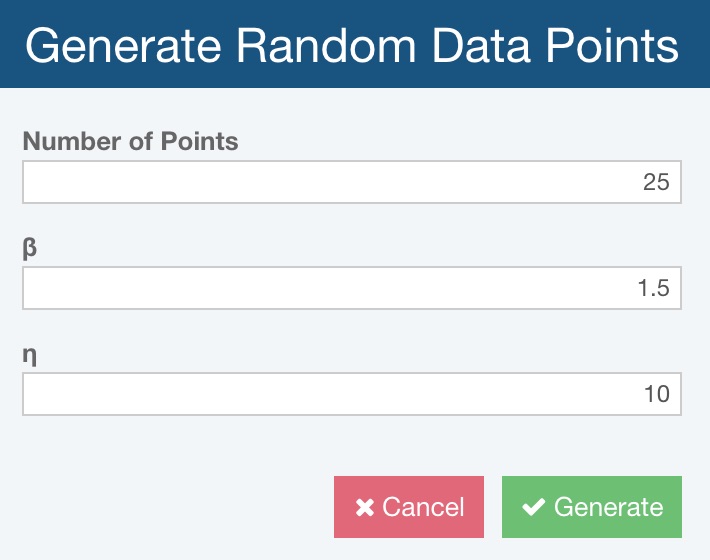
Click Generate to generate the random Data Set.
You will see the Data Points Table filled in with 25 failure times.
7. Perform Best Fit Analysis
Now, we can perform Life Data analysis on our random data. For this example, we are going to perform a best fit analysis to see which distribution best fits our data.
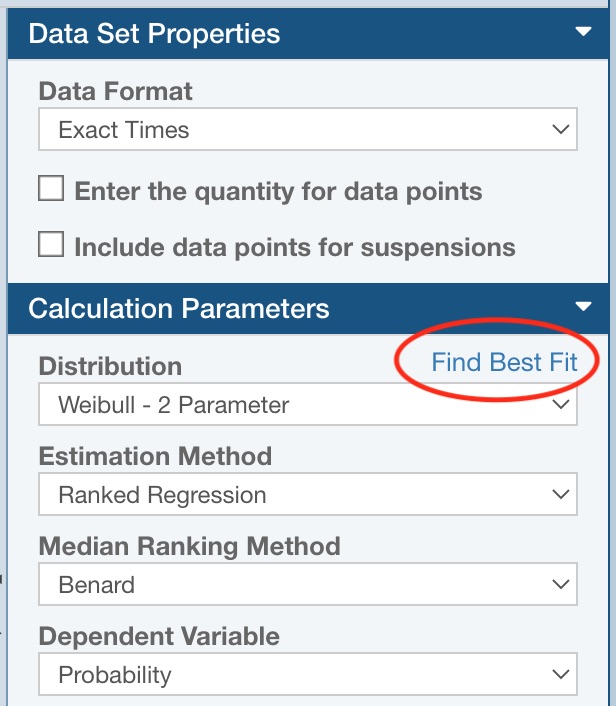
Click the Find Best Fit link in the Properties pane under the Calculation Parameters heading by the Distribution setting.
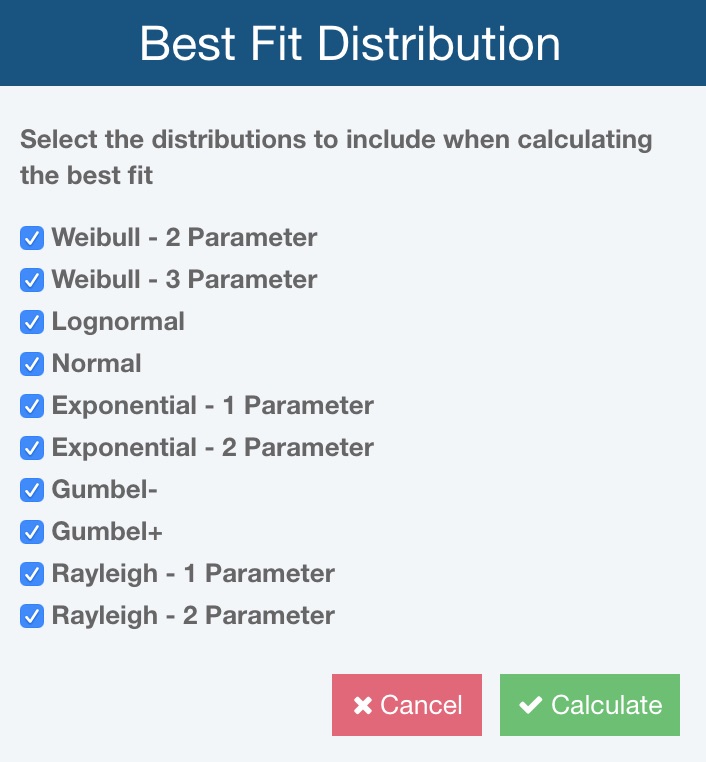
The Best Fit Distribution dialog appears. Make sure all the distributions are selected from the list. Click the Calculate button to perform the Best Fit analysis.
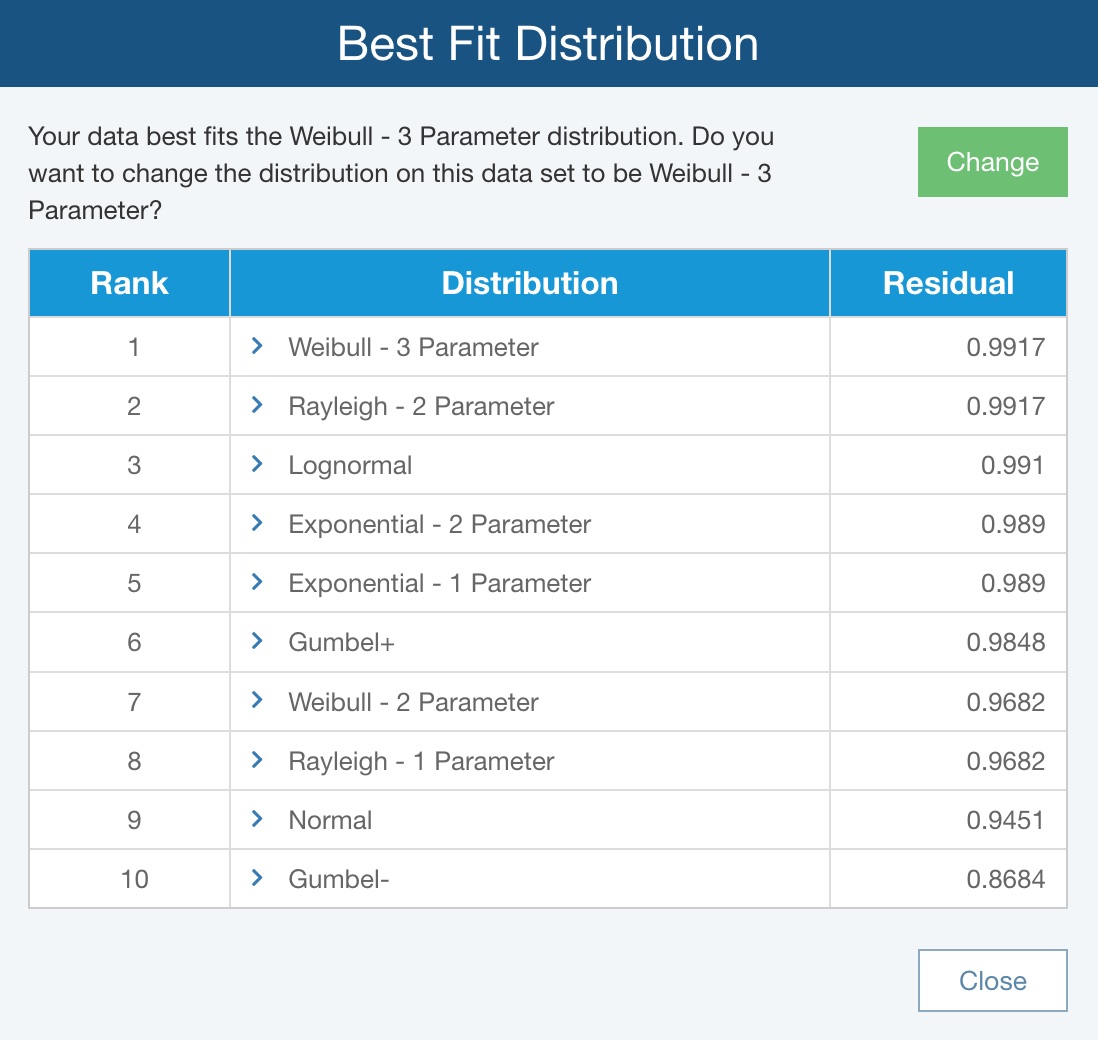
The Best Fit Distribution dialog appears with a distribution recommendation, and the results of the best fit analysis. If your Distribution selection is already set to the recommended distribution, no change will be recommended. However, if your selected Distribution does not match the recommended best fit distribution, you can click the Change button to change it.
Note: Depending on your particular set of random data, the selected distribution may vary from the screenshot below.
You can also expand any of the distributions for more details by clicking the small caret to the left of the distribution name. When expanded you can also change to the selected distribution if you prefer.
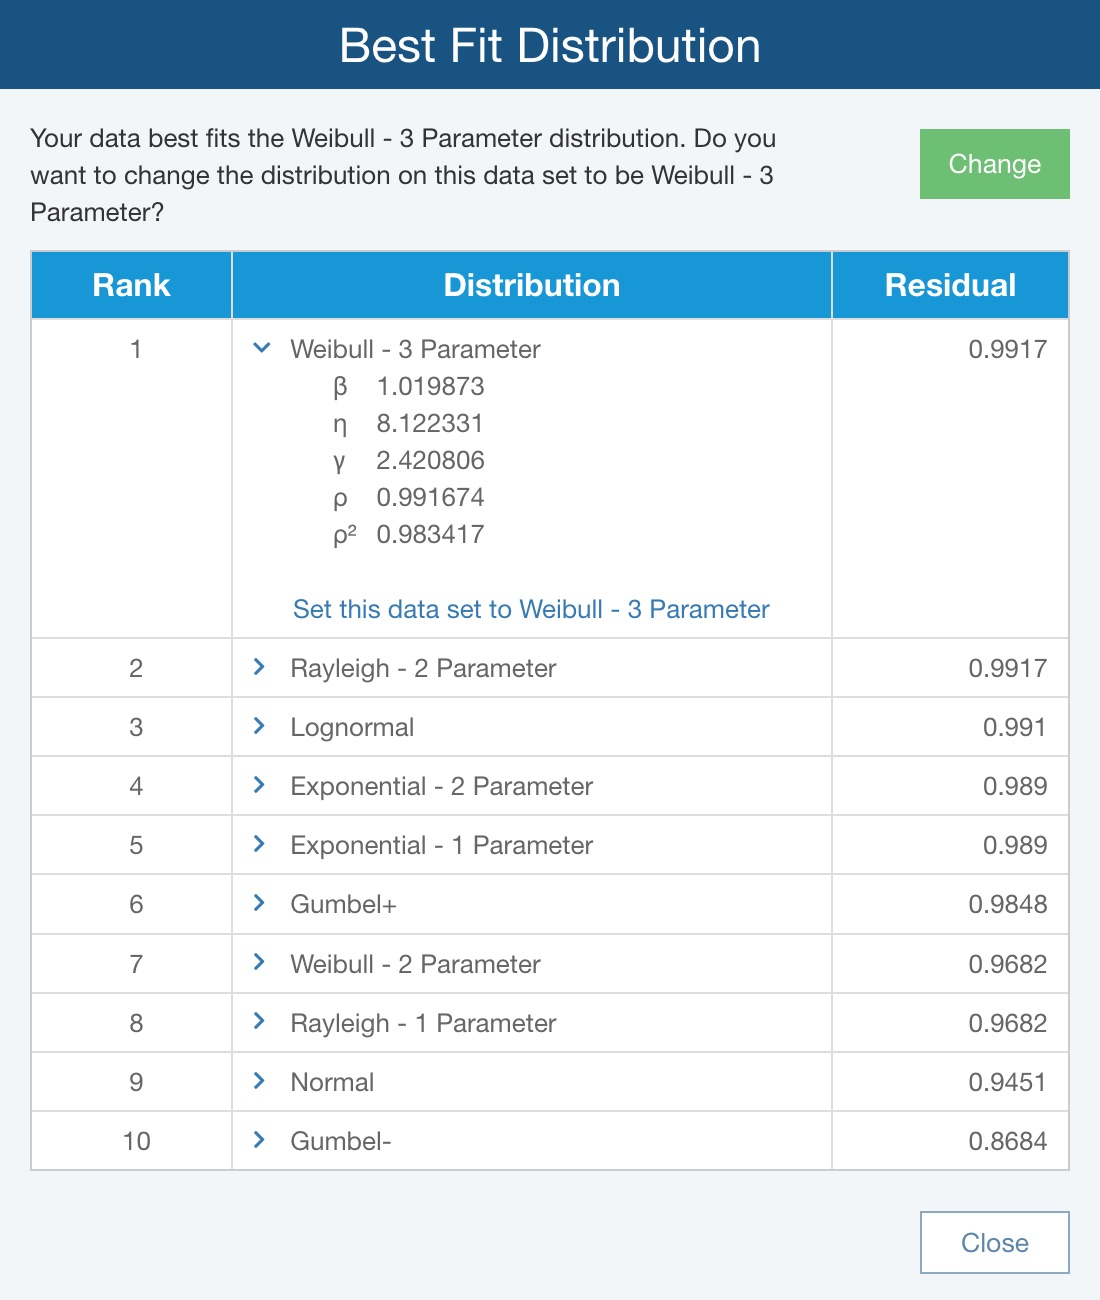
For this example, set the Distribution to the recommendation from the Best Fit analysis, and click Close.
8. Calculate
Click the To Plot button in the rightmost section of the toolbar. Because we have not yet performed a Weibull calculation, you will see that the Weibull Plot is not yet available. Also notice there are no Results in the Results section of the Properties pane.
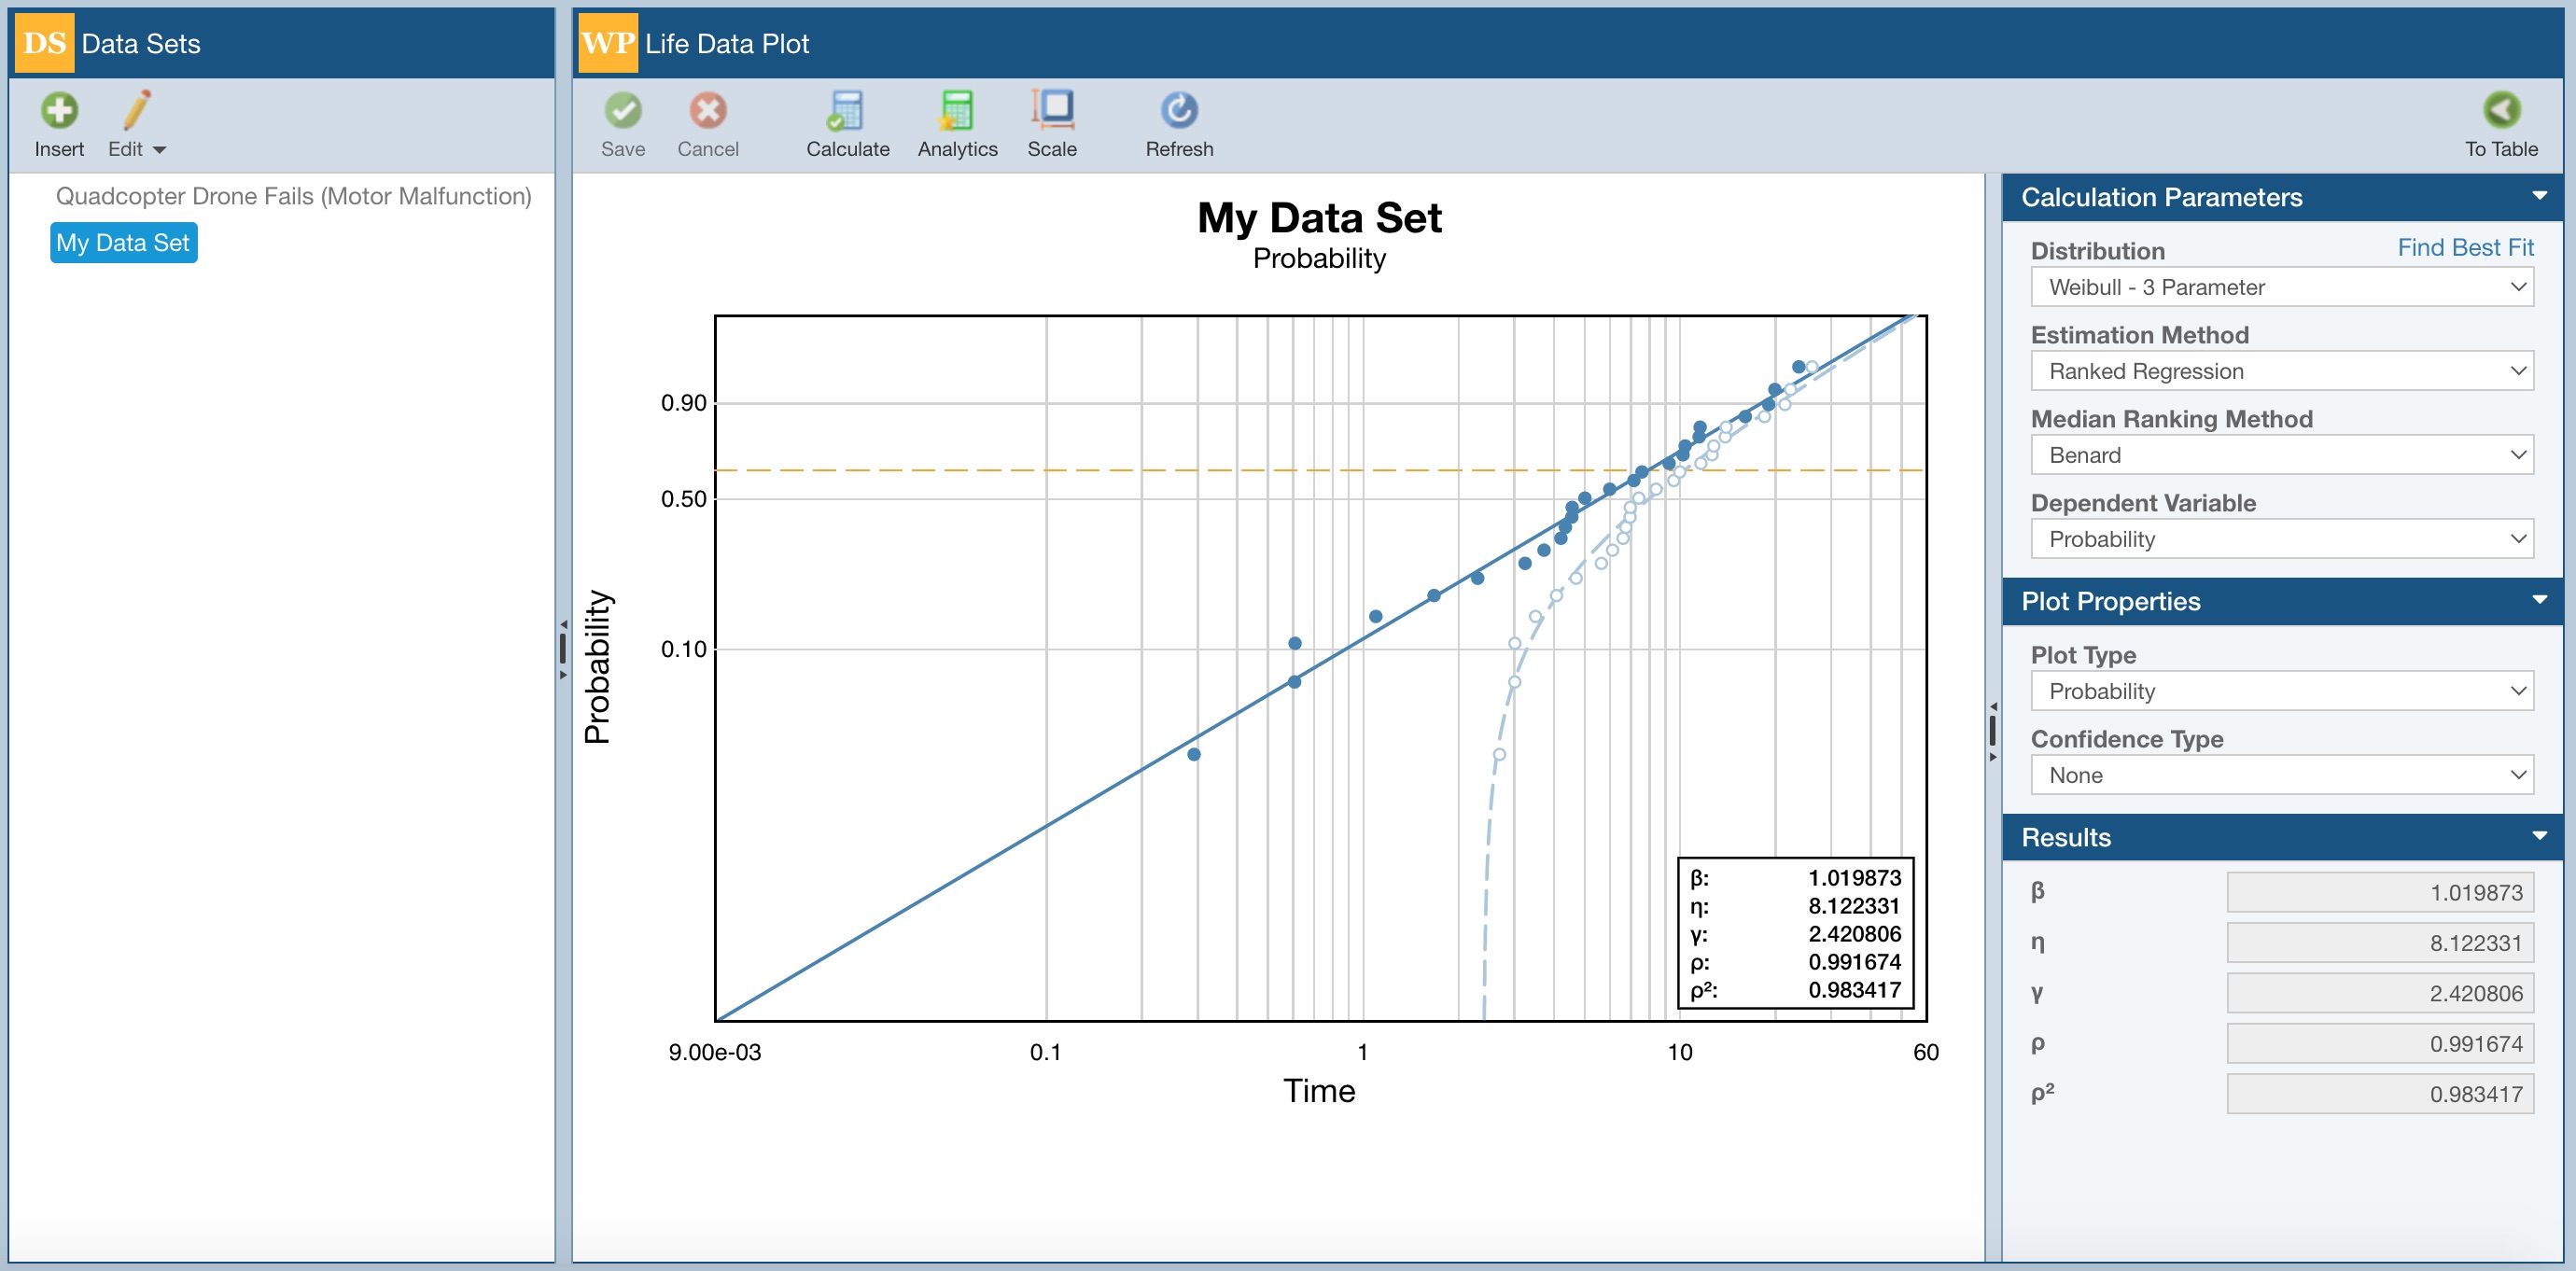
Click the Calculate button on the toolbar. As the Life Data calculation is being performed, a spinner will appear in the Calculate toolbar button to let you know a calculation is ongoing. Once completed, a green pop up message will appear in the lower right of your display to indicate that the calculation is finished. The new Life Data Plot will appear, and the new results will be shown in the Results section of the Properties pane, and also on the Plot legend.
Note: Your Life Data Plot and results will differ from this screenshot due to the variability of using randomly generated data points.
If you would like, you can test out different Plot Types, add Confidence Bounds, change distributions, adjust Plot Scaling, or generate new Data Sets. Any time you make a modification, click the Calculate button to update the analysis and view the updated Plot and results.
9. Moving on
Congratulations! You have successfully completed the Relyence Weibull Getting Started tutorial and are ready to move on!
You are welcome to continue using the Drone Example to try out some other features and functions or start with a new Analysis. To create a new Analysis, click on Drone Example on the Sidebar menu, and then click Create New... on the submenu, or select Welcome to Relyence from the Help dropdown menu and click Create New Analysis. Remember that you can also click Revert Example to start over with an original Example.
Please note that there are limitations in the Trial version in the amount of data that can be entered. You will be notified when you have reached these limits.
There are additional features not covered in the Getting Started tutorial, such as importing your failure data and integrating Weibull with your other Relyence Products. For more information on these features, go to Relyence Weibull Advanced Features.