Generating ALT Plots
Once your ALT data is entered, you will want to generate the ALT plot to review the results of the distribution analysis.
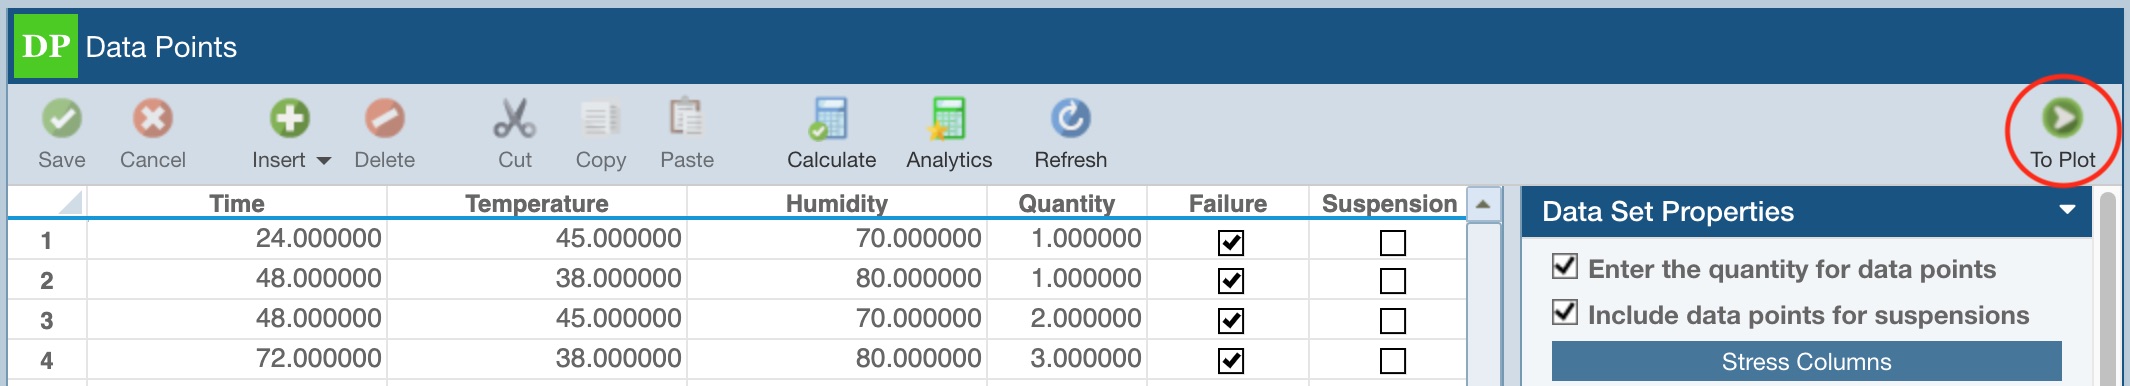
To view the ALT plot, click the To Plot button in the rightmost section of the toolbar.
If a calculation has not yet been performed, you will see that the ALT Plot is not yet available. Also notice there are no Results in the Results section of the Properties pane.
Click the Calculate button on the toolbar. When the ALT analysis is complete, the Plot will appear and the results will be shown in the Results section of the Properties pane, and also on the Plot legend.
Note: The Plot below was generated using random data, so your ALT Plot and results will differ from this screenshot.
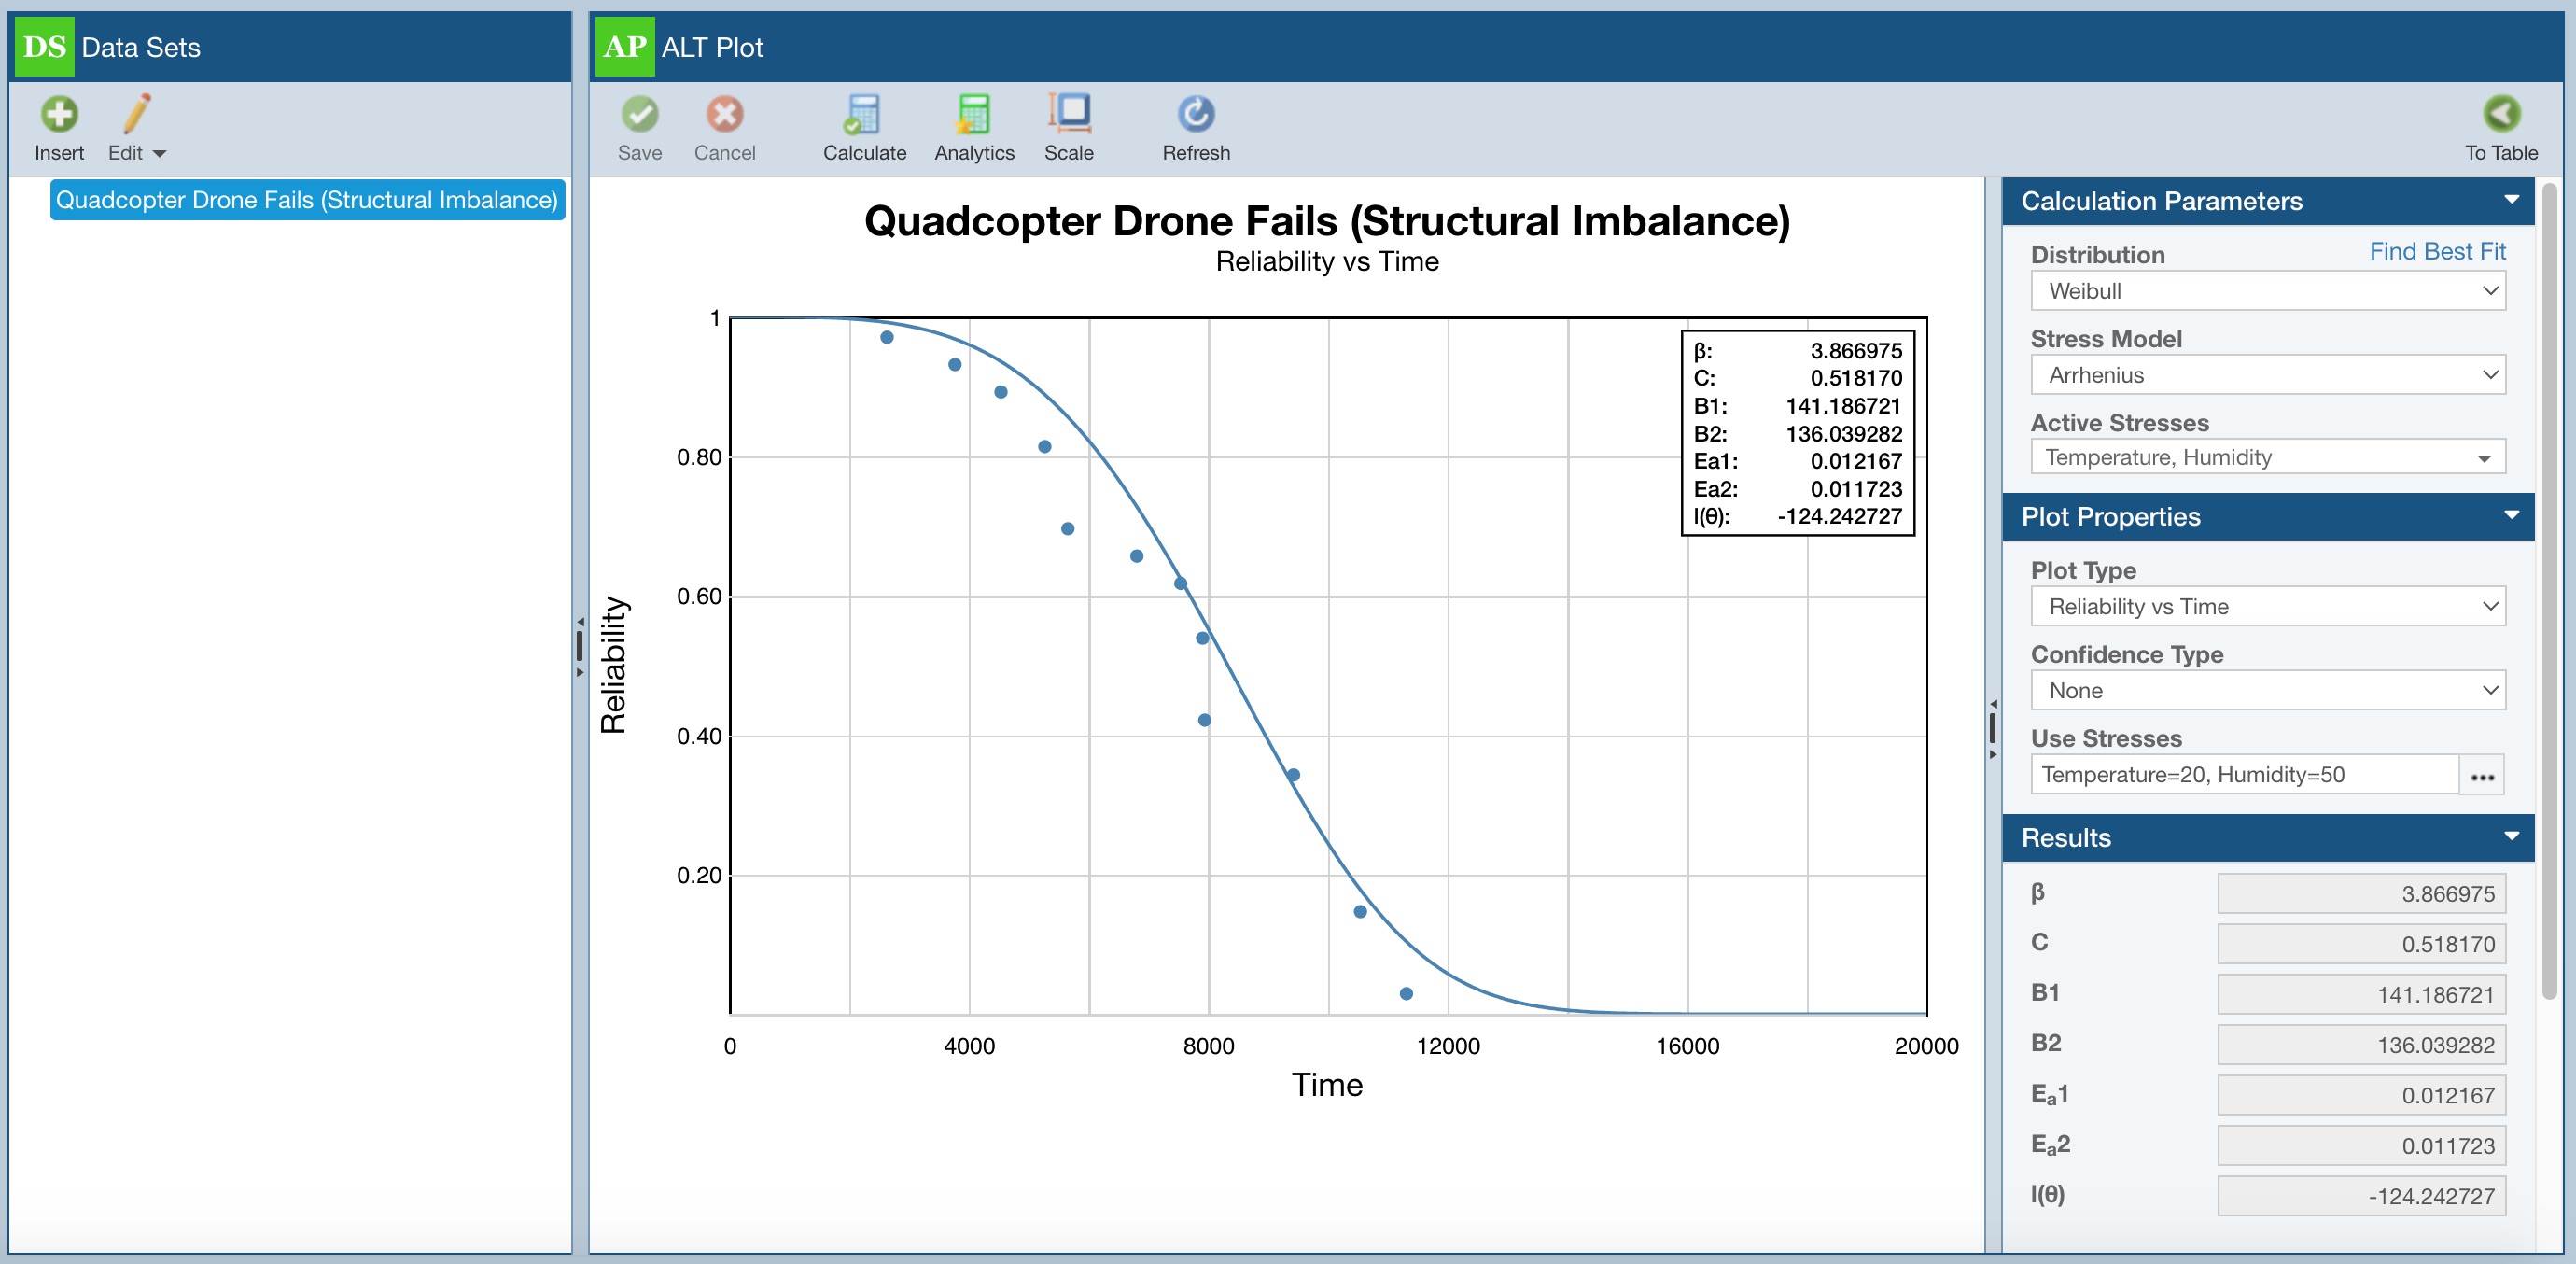
If you would like, you can test out different Plot Types, add Confidence Bounds, change distributions, or generate new Data Sets. Any time you make a modification, click the Calculate button to update the analysis and review the updated Plot and results.
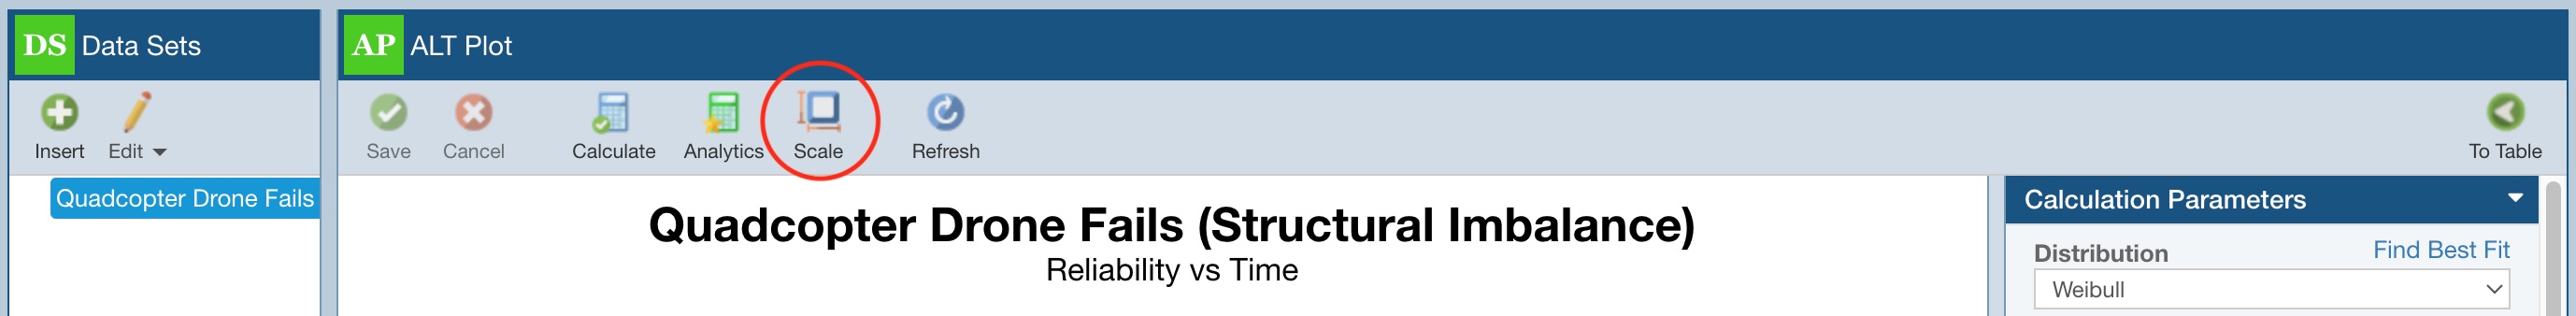
By default, Relyence ALT will autoscale the Plot. You can see the plot scaling settings by clicking Scale in the toolbar.
The Plot Scaling dialog appears.
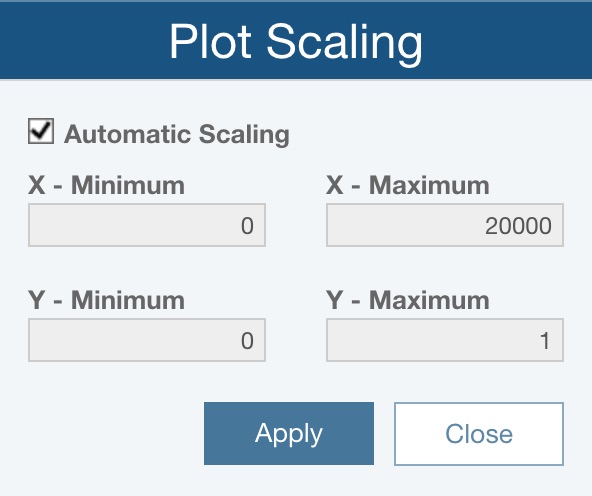
If you would like to scale the Plot, clear the Automatic Scaling checkbox, and enter your desired values for the X and Y axes minimum and maximum values.
Click Apply and/or Close as needed.