Generating Weibull Reports
Once you have completed data entry and calculation, you may want to generate a report of your Life Data or Reliability Growth plot or Life Data or Reliability Growth input data.
Generating a Weibull Plot Report
To generate a Weibull plot report, click Report from the Sidebar when the Life Data or Reliability Growth plot is displayed. A new browser tab will open with a preview of your plot in a report format.
.jpg)
You can print reports, or export them in a JPG, BMP, PNG, or SVG format.
Close the Report browser tab when you are done viewing the report.
Generating a Weibull Data Report
You may also want to create a report of your Life Data or Reliability Growth input data. To do this, click the To Table toolbar button, if needed, to view the Data Points Table.
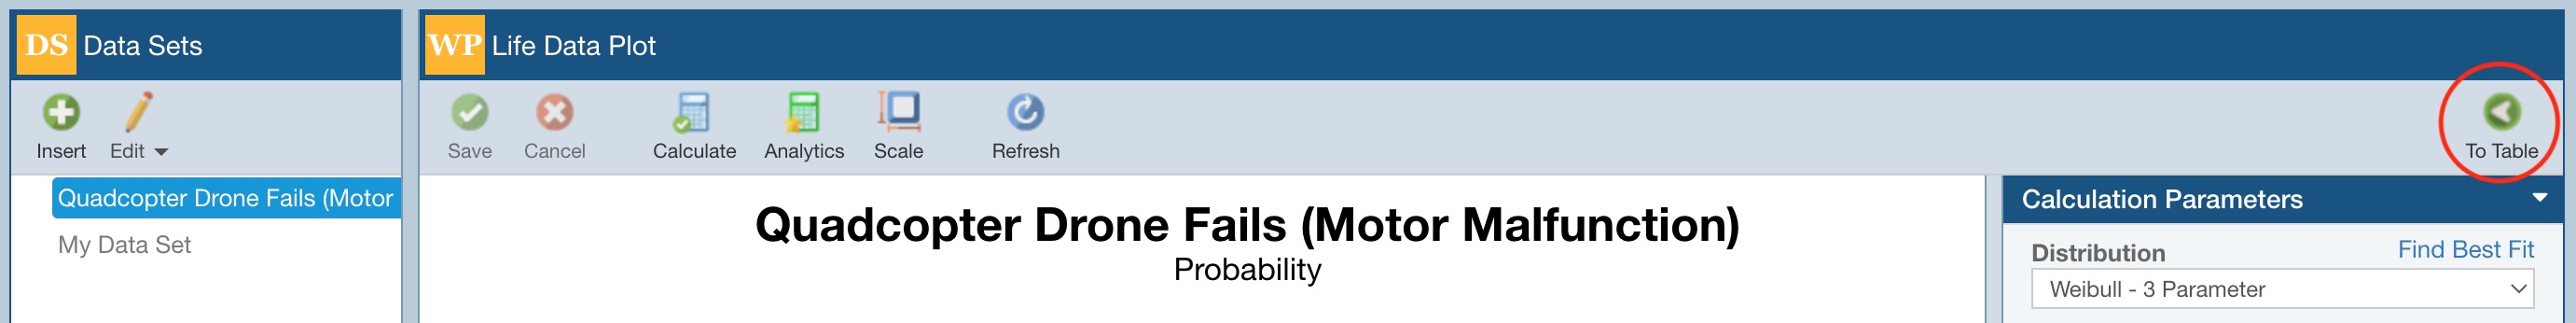
Click Report from the Sidebar menu.
The Report Options dialog appears.
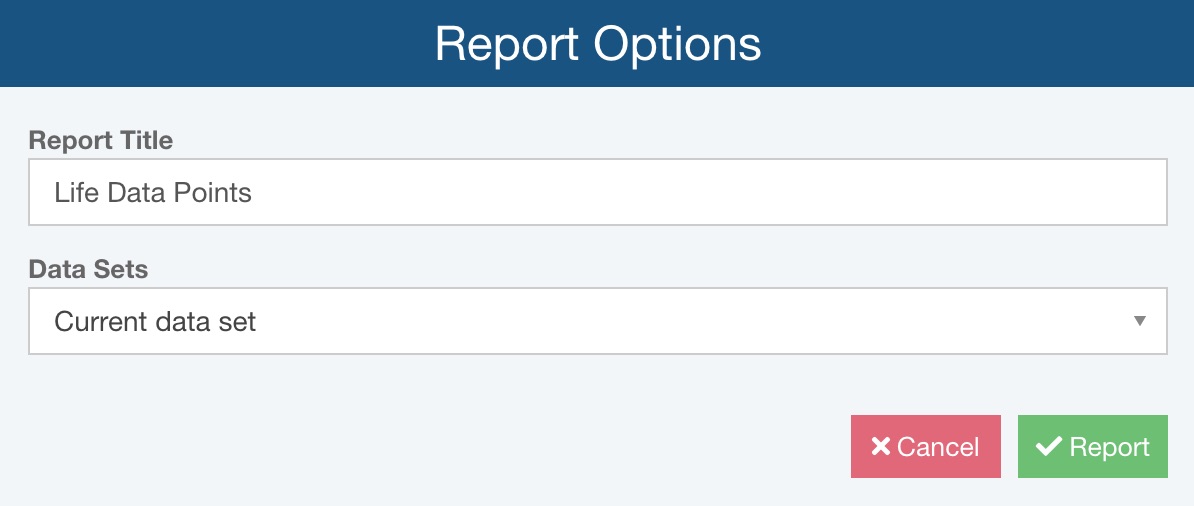
Enter a Report title. Select Current data set or All data sets from the Data sets dropdown list depending on what you want to see in your report. Click the Report button to generate the report.
The report appears in a new browser tab.
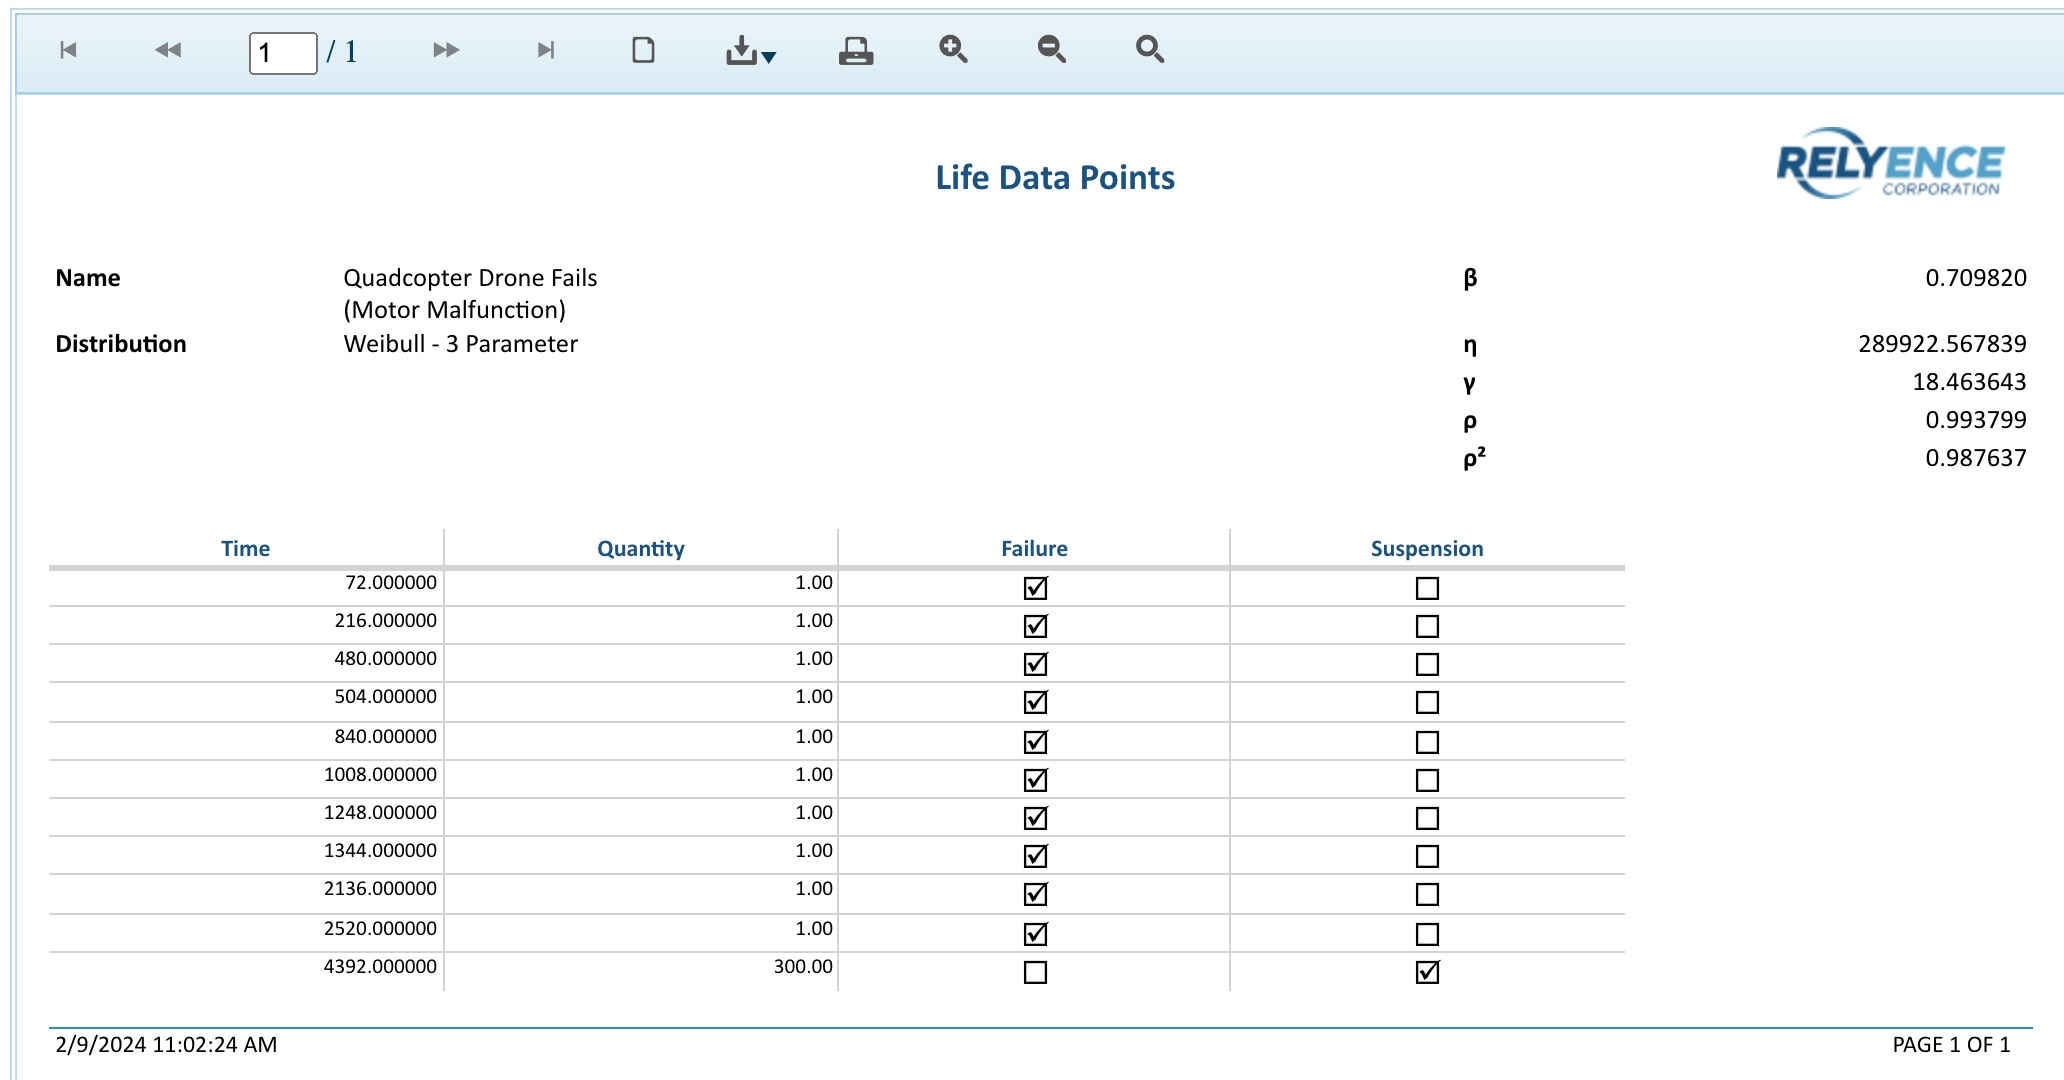
You can print reports, or save them in a PDF, Excel, PowerPoint, TIFF, or Word format.
Close the Report browser tab when you are done viewing the report.