Weibull Properties Pane Settings
The Weibull Properties Pane includes information and settings about your Weibull Data Points Table for Life Data or Reliability Growth analysis or your Life Data or Reliability Growth Plot.
Weibull Properties Pane Settings for Life Data Sets
When the Data Points Table is displayed for a Life Data Set, the following sections appear:
- Data Set Properties
- Calculation Parameters
- Results
When the Plot is displayed for a Life Data Plot, the following sections appear:
- Calculation Parameters
- Plot Properties
- Results
Each section can be expanded and collapsed using the expand/collapse arrow icon in the right corner of the section header.
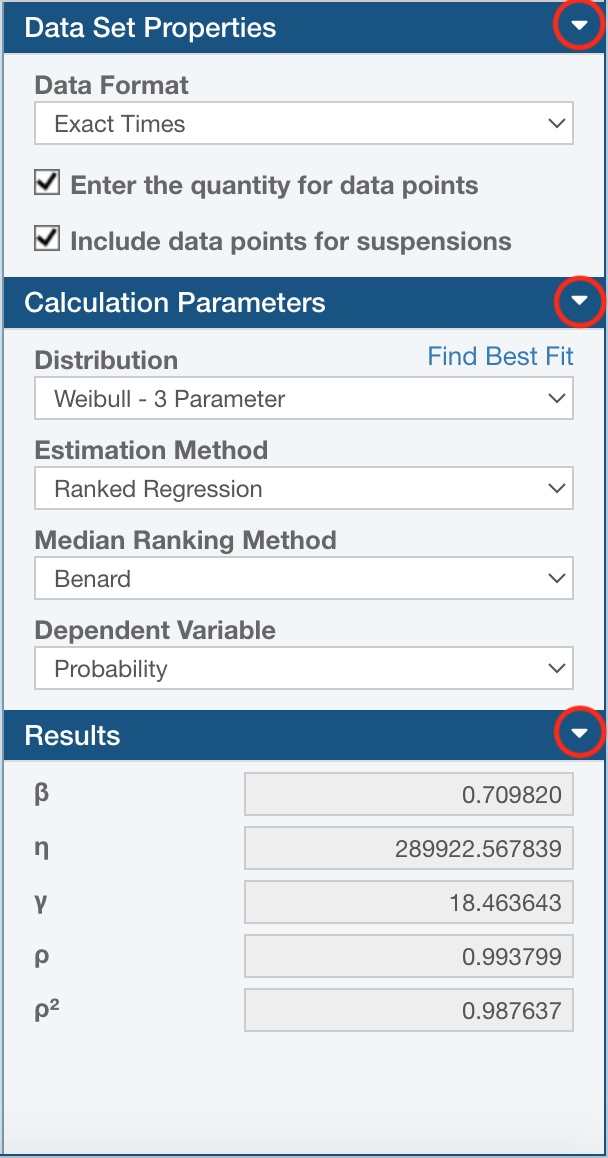
Data Set Properties (shown when the Data Points Table is displayed for Life Data Sets)
The Data Set Properties section allows you to configure the Data Points Table to match the data format you are using for your Life Data analysis.
By default, the Data Points Table is set to the simplest form of Life Data: a set of Failure Time points. To change this data format to match your Life Data, set the appropriate selections in the Data Set Properties section.
If you have interval data instead of Failure Times, select Intervals from the Data Format dropdown list. If Intervals is selected, the Data Points Table will display two columns: Start of Interval and End of Interval.
By default, it is assumed that each data point represents a single failure. If you want to enter a quantity with your data points, select the Enter the quantity for data points checkbox. The Quantity column will appear in the Data Points Table.
Be default, each data point is assumed to be a failure. If you would like to also include suspension data, select the Include data points for suspensions checkbox. When selected, the Failure and Suspension columns will appear in the Data Points Table, and you must indicate if the data point represents a failure or a suspension. By default, data points will be set to failure.
Calculation Parameters (shown when the Data Points Table or Life Data Plot is displayed for Life Data Sets)
The Calculation Parameters allow you to select the settings you wish to use for the Life Data analysis calculations.
First, select the desired distribution from the Distribution dropdown list. Available distributions include 2 and 3 parameter Weibull, 1 and 2 parameter Exponential, Normal, Lognormal, Gumbel-, Gumbel+, and 1 and 2 parameter Rayleigh. Relyence will use 2-parameter Weibull by default.
Second, select the Estimation Method of MLE, MMLE, or Ranked Regression. The Relyence default setting is Ranked Regression.
Third, select the Median Ranking Method from the list of choices: Median, Benard, Mean, Hazen, or Kaplan-Meier. The Relyence default setting is Benard.
Lastly, depending on previous selections:
- If you are using the Ranked Regression Estimation Method, select the Dependent Variable of either Time or Probability. The Relyence default setting is Probability.
- If you are using the MMLE Estimation Method, select the MMLE Type of either RBD Median (Standard) or RBA Mean. The Relyence default setting is RBA Mean.
Plot Properties (shown when the Life Data Plot is displayed)
The Plot Properties allow you to select the settings you wish to use for your Life Data Plots.
First, select the desired type from the Plot Type dropdown list. Available Plot Types are Probability, Reliability vs Time, Unreliability vs Time, Failure Rate vs Time, and PDF (Probability Density Function) Plot. Relyence will use Probability by default.
If applicable, the Confidence Type enables you to add confidence bound lines to your Weibull Plots. You can select from None, Lower Confidence, Upper Confidence, Double Confidence, or Upper and Lower Confidence. The Relyence default setting is None.
Lastly, define details for confidence bounds (for cases where Confidence Type is not set to None):
- Select the Confidence Level percentage you want to use when calculating the confidence bounds. You can enter a value from 1 - 100. The Relyence default setting is 90.
- Select the Confidence Method to use for computation. Choose from Fisher Matrix, Likelihood Ratio, or Binomial. The Relyence default setting is Fisher Matrix.
- If prompted, select the Confidence Bound Type. Options are Time and Reliability. The Relyence default setting is Reliability.
Results (shown when the Data Points Table or Life Data Plot is displayed for Life Data Sets)
The Results section is for informational purposes only. The data in this section is not editable. The Results pane displays the Life Data analysis parameters from the most recent Life Data analysis calculation.
Weibull Properties Pane Settings for Reliability Growth Data Sets
When the Data Points Table is displayed for a Reliability Growth Data Set, the following sections appear:
- Data Set Properties
- Calculation Parameters
- Results
When the Plot is displayed for a Reliability Growth Plot, the following sections appear:
- Calculation Parameters
- Plot Properties
- Results
Each section can be expanded and collapsed using the expand/collapse arrow icon in the right corner of the section header.
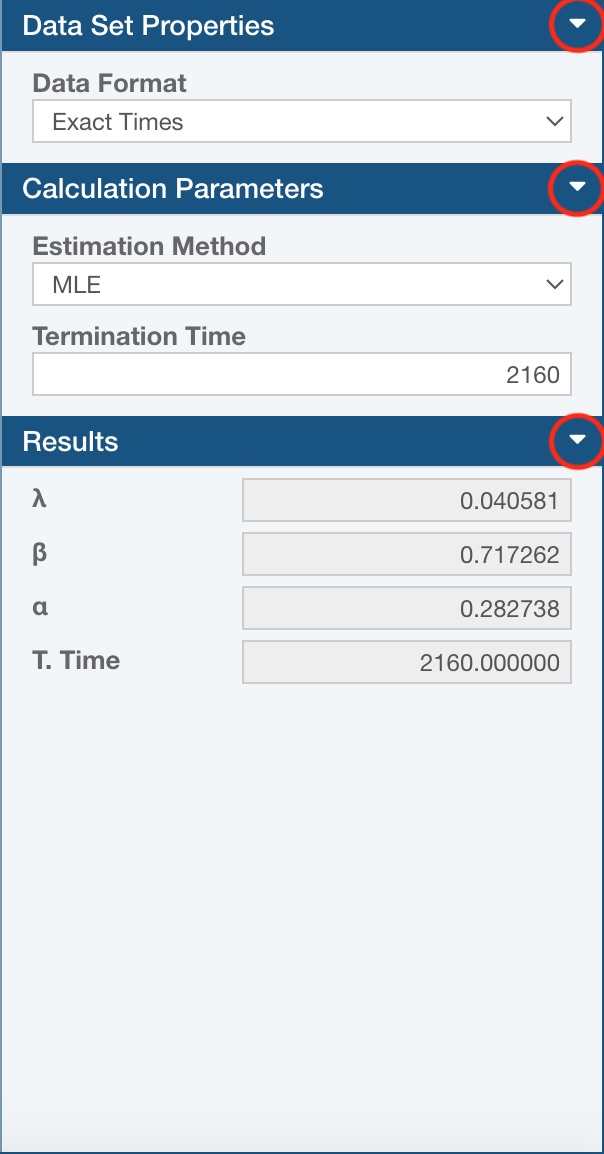
Data Set Properties (shown when the Data Points Table is displayed for Reliability Growth Data Sets)
The Data Set Properties section allows you to configure the Data Points Table to match the data format you are using for your Reliability Growth analysis.
By default, the Data Points Table is set to the simplest form of Reliability Growth Data: a set of Failure Time points. To change this data format to match your Reliability Growth Data, set the appropriate selections in the Data Set Properties section.
If you have interval data instead of Failure Times, select Intervals from the Data Format dropdown list. If Intervals is selected, the Data Points Table will display two columns: Start of Interval and End of Interval. The Quantity column will also appear in the Data Points Table to account for multiple failures in a given interval.
Calculation Parameters (shown when the Data Points Table or Reliability Growth Plot is displayed for Reliability Growth Data Sets)
The Calculation Parameters allow you to select the settings you wish to use for the Reliability Growth analysis calculations.
Select the Estimation Method of MLE or Ranked Regression. The Relyence default setting is MLE.
Enter the Termination Time, or the time at which to test was ended.
Plot Properties (shown when the Reliability Growth Plot is displayed)
The Plot Properties allow you to select the settings you wish to use for your Reliability Growth Plots.
First, select the desired type from the Plot Type dropdown list. Available Plot Types are Cumulative Failure Rate, Cumulative Failures, Cumulative MTBF, Cumulative Occurrence, Instantaneous Failure Rate and Instantaneous MTBF. Relyence will use Cumulative Occurrence by default.
Second, the Confidence Type enables you to add confidence bound lines to your Reliability Growth Plots. You can select from None, Lower Confidence, Upper Confidence, Double Confidence, or Upper and Lower Confidence. The Relyence default setting is None.
Lastly, define details for confidence bounds (for cases where Confidence Type is not set to None):
- Select the Confidence Level percentage you want to use when calculating the confidence bounds. You can enter a value from 1 - 100. The Relyence default setting is 90.
- Select the Confidence Method to use for computation. Choose from Crow and Fisher Matrix. The Relyence default setting is Crow.
- Select the Confidence Bound Type. Options are Time and Failures. The Relyence default setting is Failures.
Results (shown when the Data Points Table or Reliability Growth Plot is displayed for Reliability Growth Data Sets)
The Results section is for informational purposes only. The data in this section is not editable. The Results pane displays the Reliability Growth analysis parameters from the most recent Reliability Growth analysis calculation.