Weibull Properties
Weibull Properties allows you to customize your Weibull plots and customize Time. To access Weibull Properties, click Properties from the Sidebar menu when Relyence Weibull is active. The Weibull Properties dialog appears.
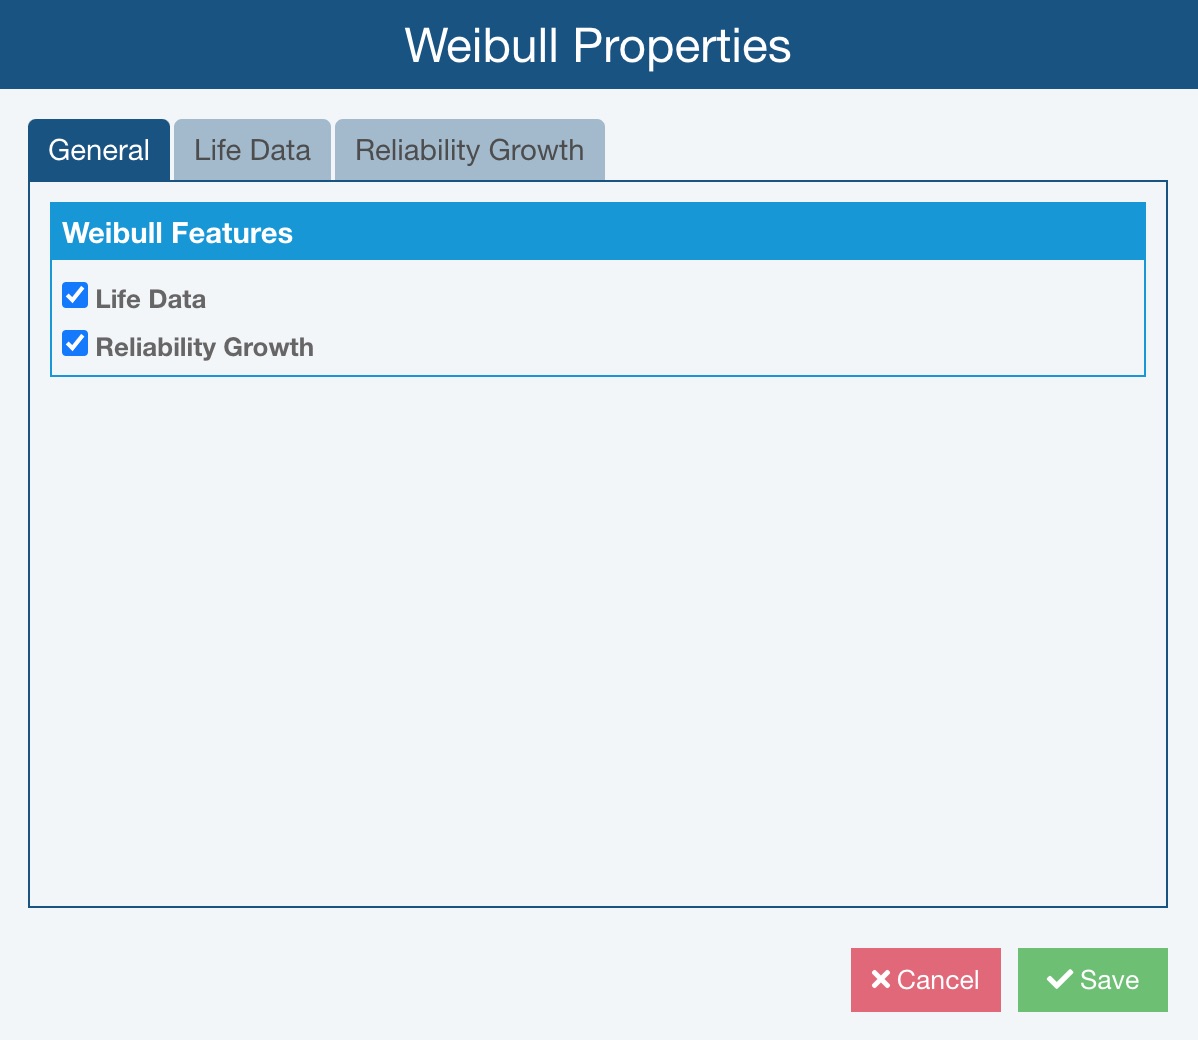
Weibull Properties - General Tab
Relyence Weibull supports both Life Data analysis and Reliability Growth Analysis. You can turn on and off either type of analysis at any time by selecting and clearing the appropriate checkboxes.
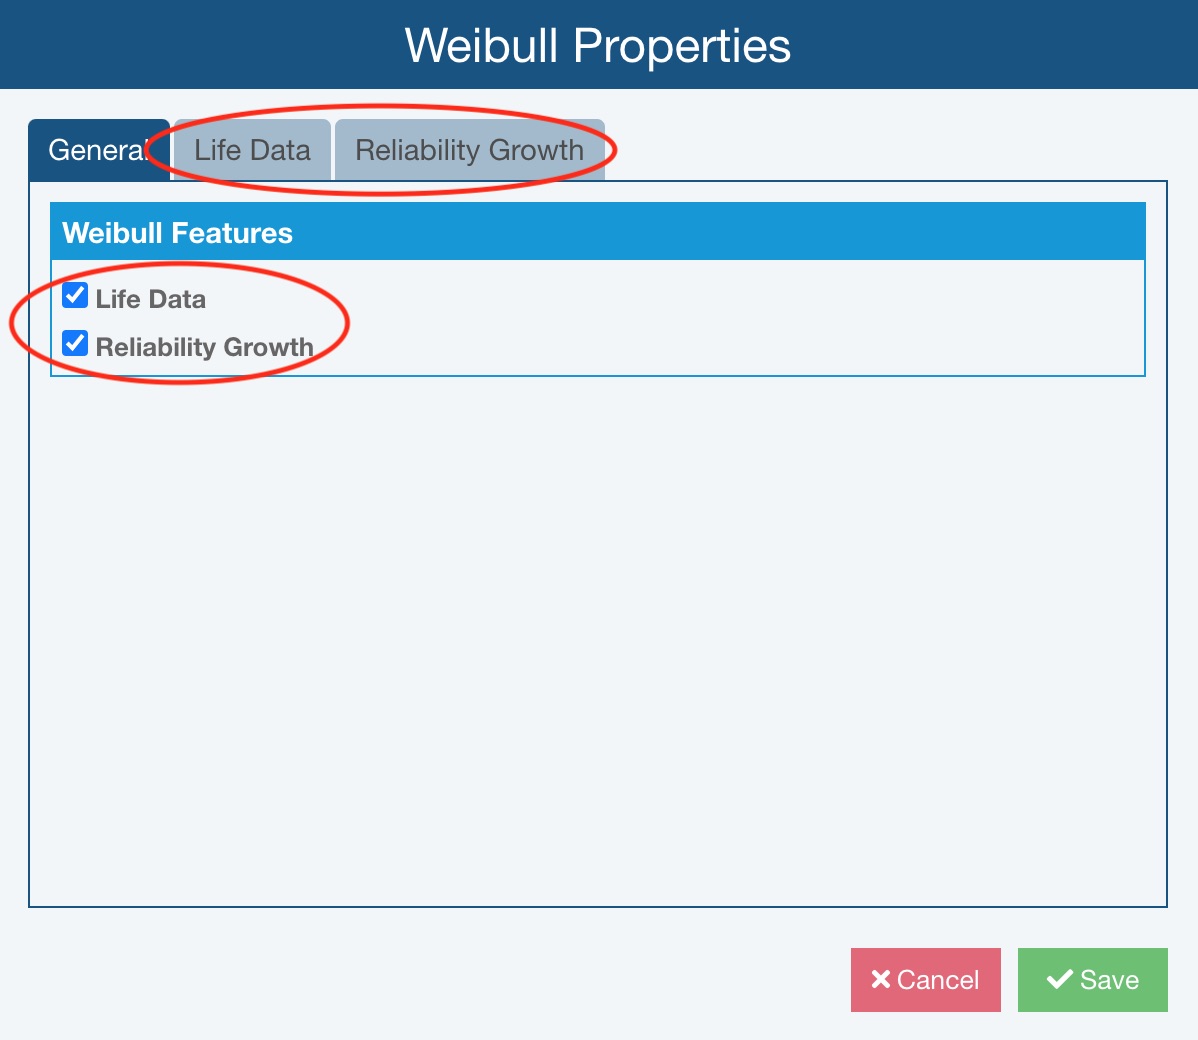
When either Weibull data type is on in an Analysis, there is a corresponding properties tab for that data type.
For example, in an Analysis with both Life Data and Reliability Growth turned on, the Weibull Properties dialog will also include the Life Data and Reliability Growth tabs.
Weibull Properties - Life Data Tab
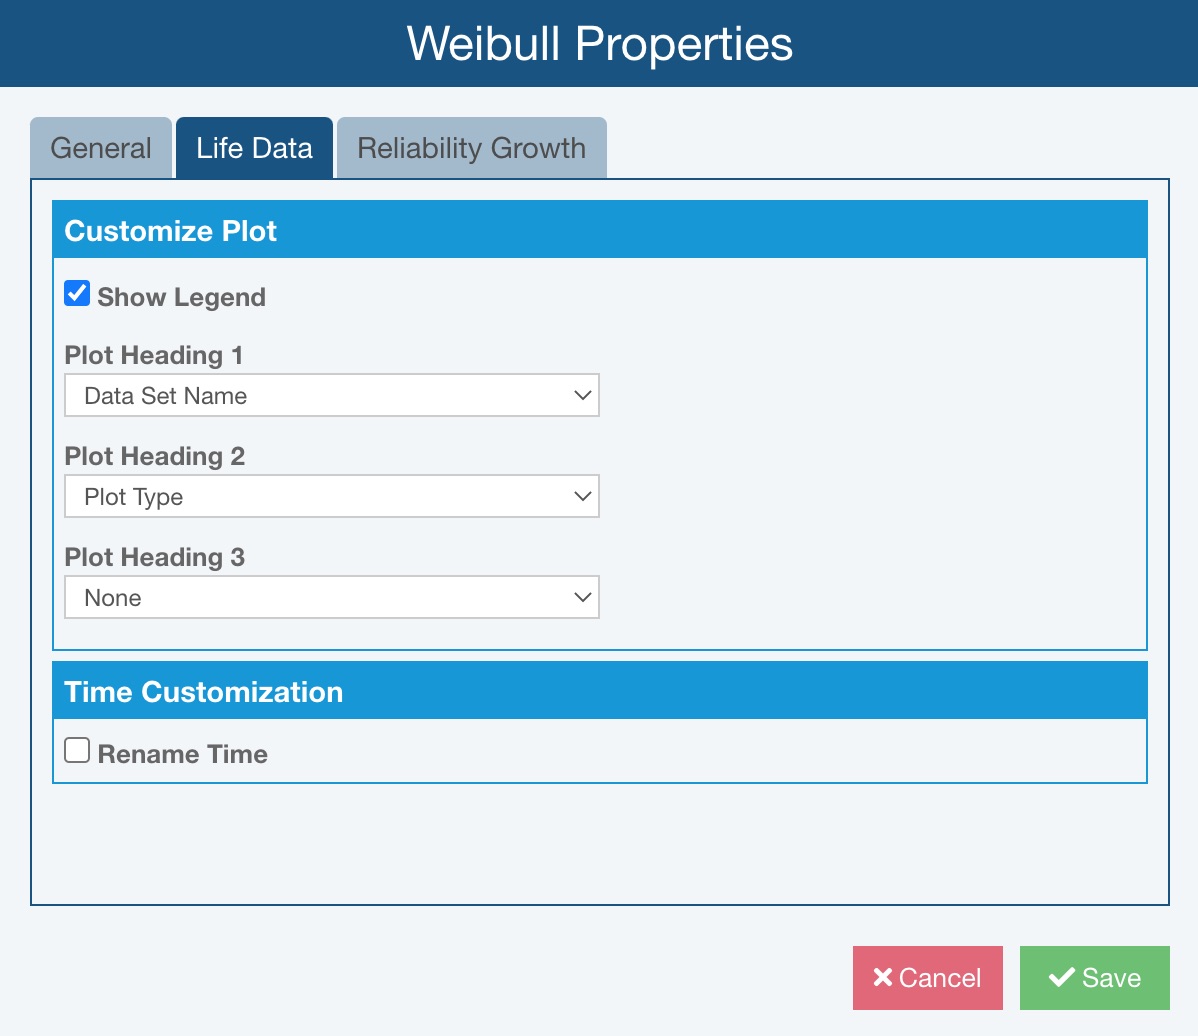
Customize Plot
Options on the Life Data tab of the Weibull Properties dialog allow you to customize your Life Data plots.
Show Legend
If you want a legend, or the box that includes the Weibull calculation results, on your Weibull plot, select Show Legend, otherwise, clear it.
Plot Heading 1, 2, and 3
Weibull plots can include up to 3 headings. By default, the main title heading is set to the Data Set Name, the subheading is set to the Plot Type, and the third heading is off. Select your preferences for the three headings: None, Plot Type, Data Set Name, or Distribution.
Time Customization
Relyence Weibull provides the option to rename the default Time field.
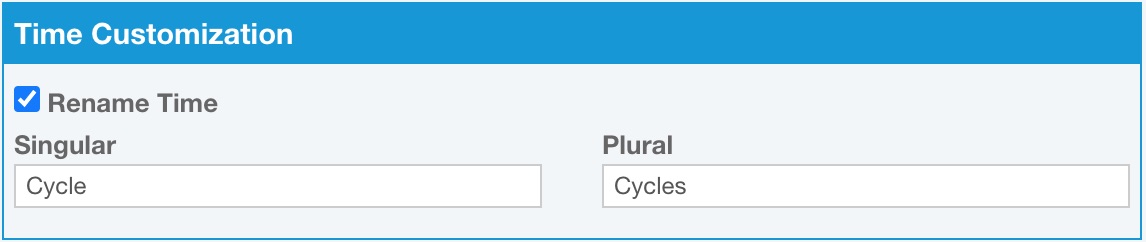
Rename Time
If you prefer an alternate naming convention for Time, given that, for example, you collect data based on cycles or some other non-time-specific measure, select the Rename Time checkbox and enter the terms you prefer.
Weibull Properties - Reliability Growth Tab
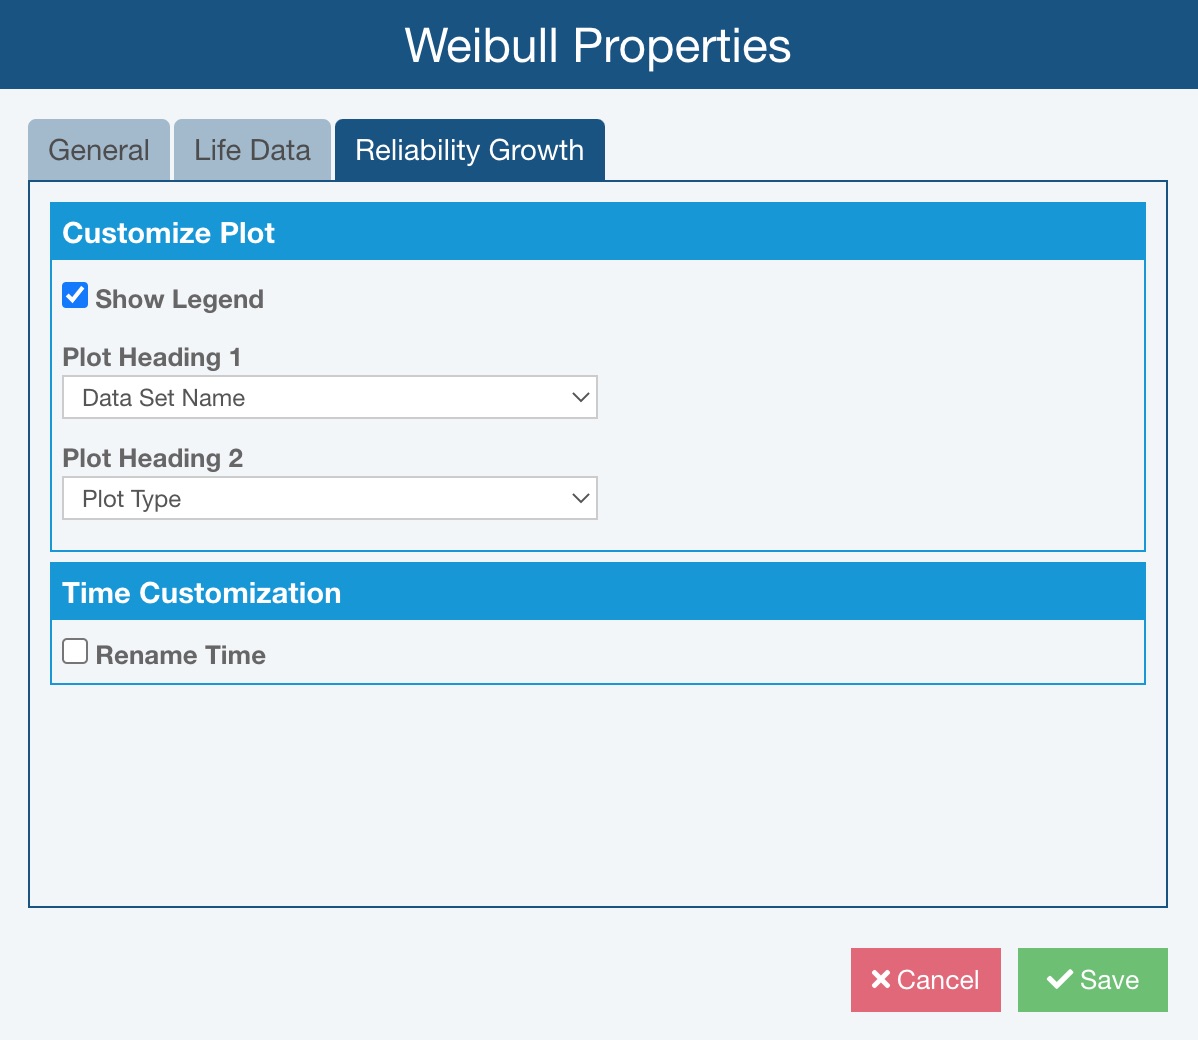
Customize Plot
Options on the Reliability Growth tab of the Weibull Properties dialog allow you to customize your Reliability Growth plots.
Show Legend
If you want a legend, or the box that includes the Weibull calculation results, on your Weibull plot, select Show Legend, otherwise, clear it.
Plot Heading 1 and 2
Reliability Growth plots can include up to 2 headings. By default, the main title heading is set to the Data Set Name and the subheading is set to the Plot Type. Select your preferences for both headings: None, Plot Type, Data Set Name, or Distribution.
Rename Time
If you prefer an alternate naming convention for Time, given that, for example, you collect data based on cycles or some other non-time-specific measure, select the Rename Time checkbox and enter the terms you prefer.
Click Save to save your selections.