Performing a PFMEA
Relyence PFMEA contains four elements: the P-Diagram (Parameter Diagram), the Process Flow Diagram (PFD), the PFMEA Worksheet, and the Control Plan (CP). In Relyence, the Process Flow Diagram (PFD), the PFMEA Worksheet, and the Control Plan (CP) remain in sync to keep your PFMEA organized and always up-to-date.
However, each of the Relyence PFMEA elements can be used stand-alone. For example, if you only want to use the PFMEA Worksheet, you can do that. You can optionally use any combination of the four PFMEA elements.
Typically, PFMEA in Relyence FMEA is a five-step process: you build the Analysis Tree (if applicable), then you create your P-Diagram, then you create your Process Flow Diagram, then complete the PFMEA Worksheet, and finally, create your Control Plan. This typical scenario is described in this topic.
Step 1: Build the Analysis Tree (optional)
You may choose to employ some type of hierarchical structure to organize your FMEAs. Any such structure is created in the Analysis Tree pane. In PFMEA, the Analysis Tree can be used to list the processes under review. You can also use the Analysis for any purpose in order to help with ease of management and team collaboration.
Each element in your tree has a separate FMEA Worksheet associated with it.
For more details, see the The FMEA Analysis Tree topic.
Step 2: Create a P-Diagram
Note that by default, P-Diagrams are not enabled in Relyence Analyses. To review how to turn on P-Diagrams in your Analysis, see the FMEA Properties topic for more details.
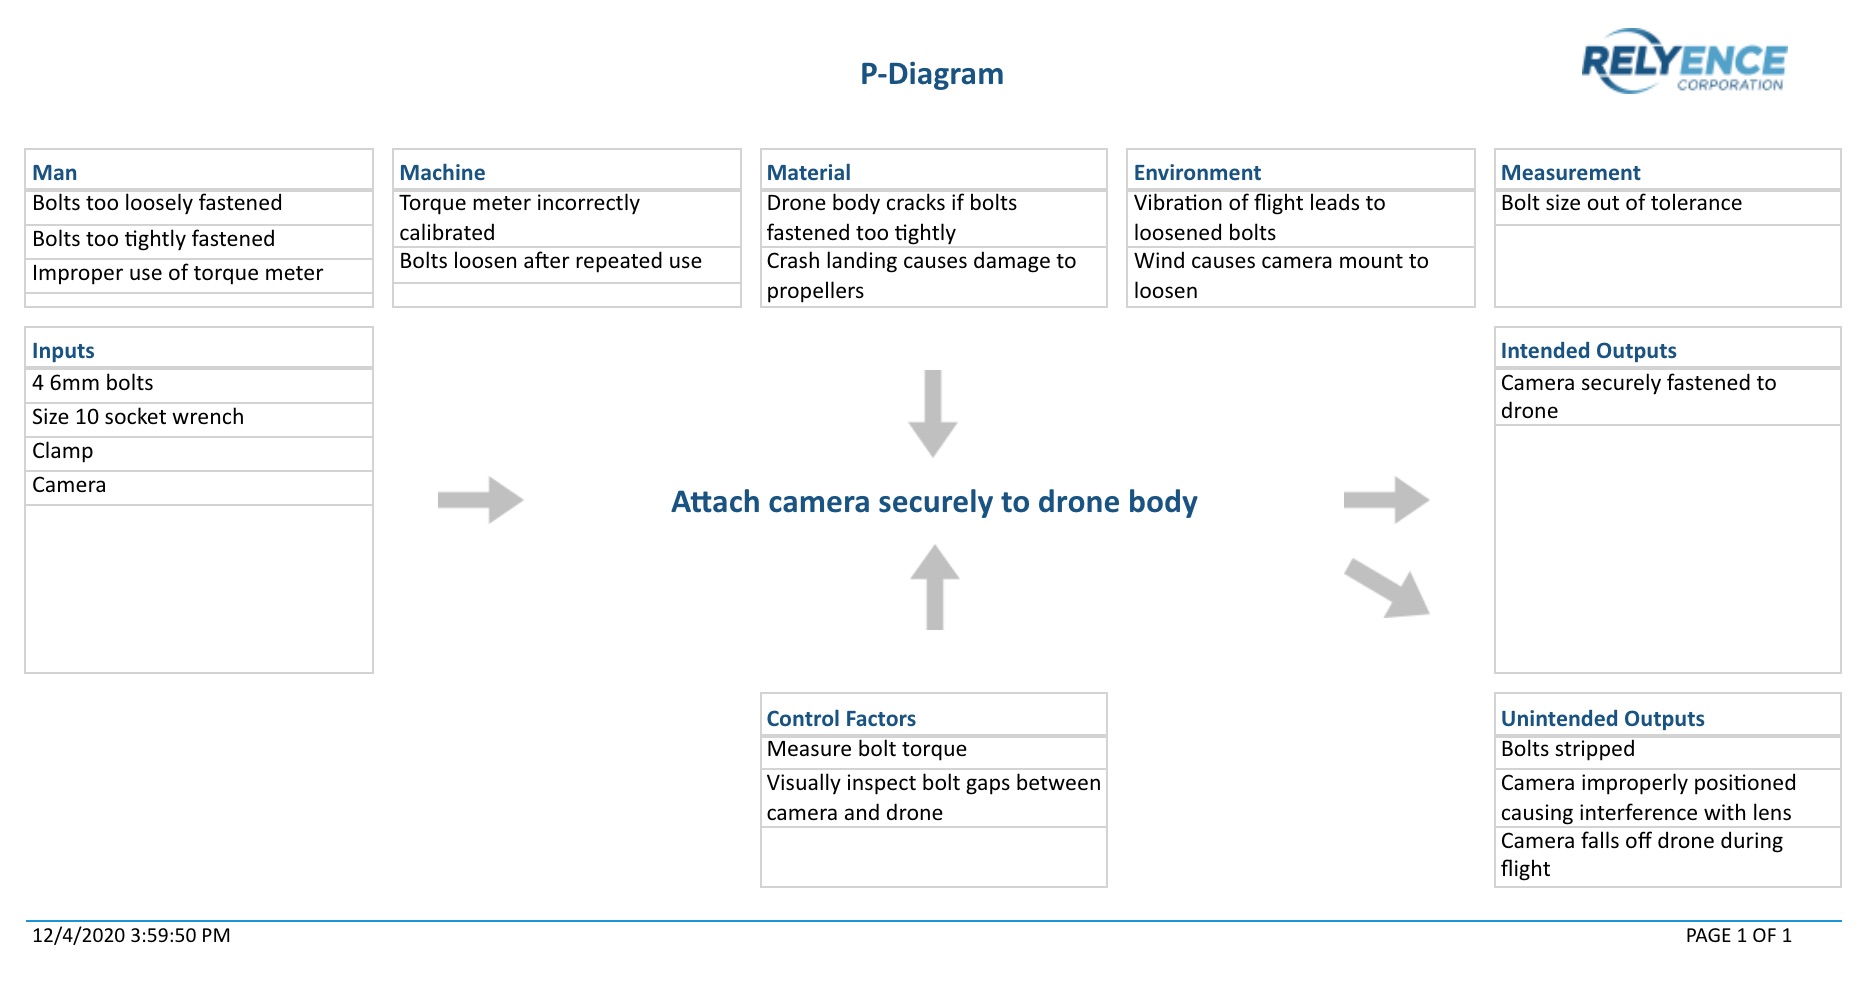
The FMEA process optionally begins with the creation of a P-Diagram, or Parameter Diagram. The P-Diagram describes inputs and expected outputs, along with unintended outputs, noise factors, and control factors. Developing a well-defined P-Diagram can provide useful input for the FMEA, including details like Failure Causes, Failure Modes, Effects, Current Controls, and Recommended Actions.
The following steps are used to create or review your P-Diagram:
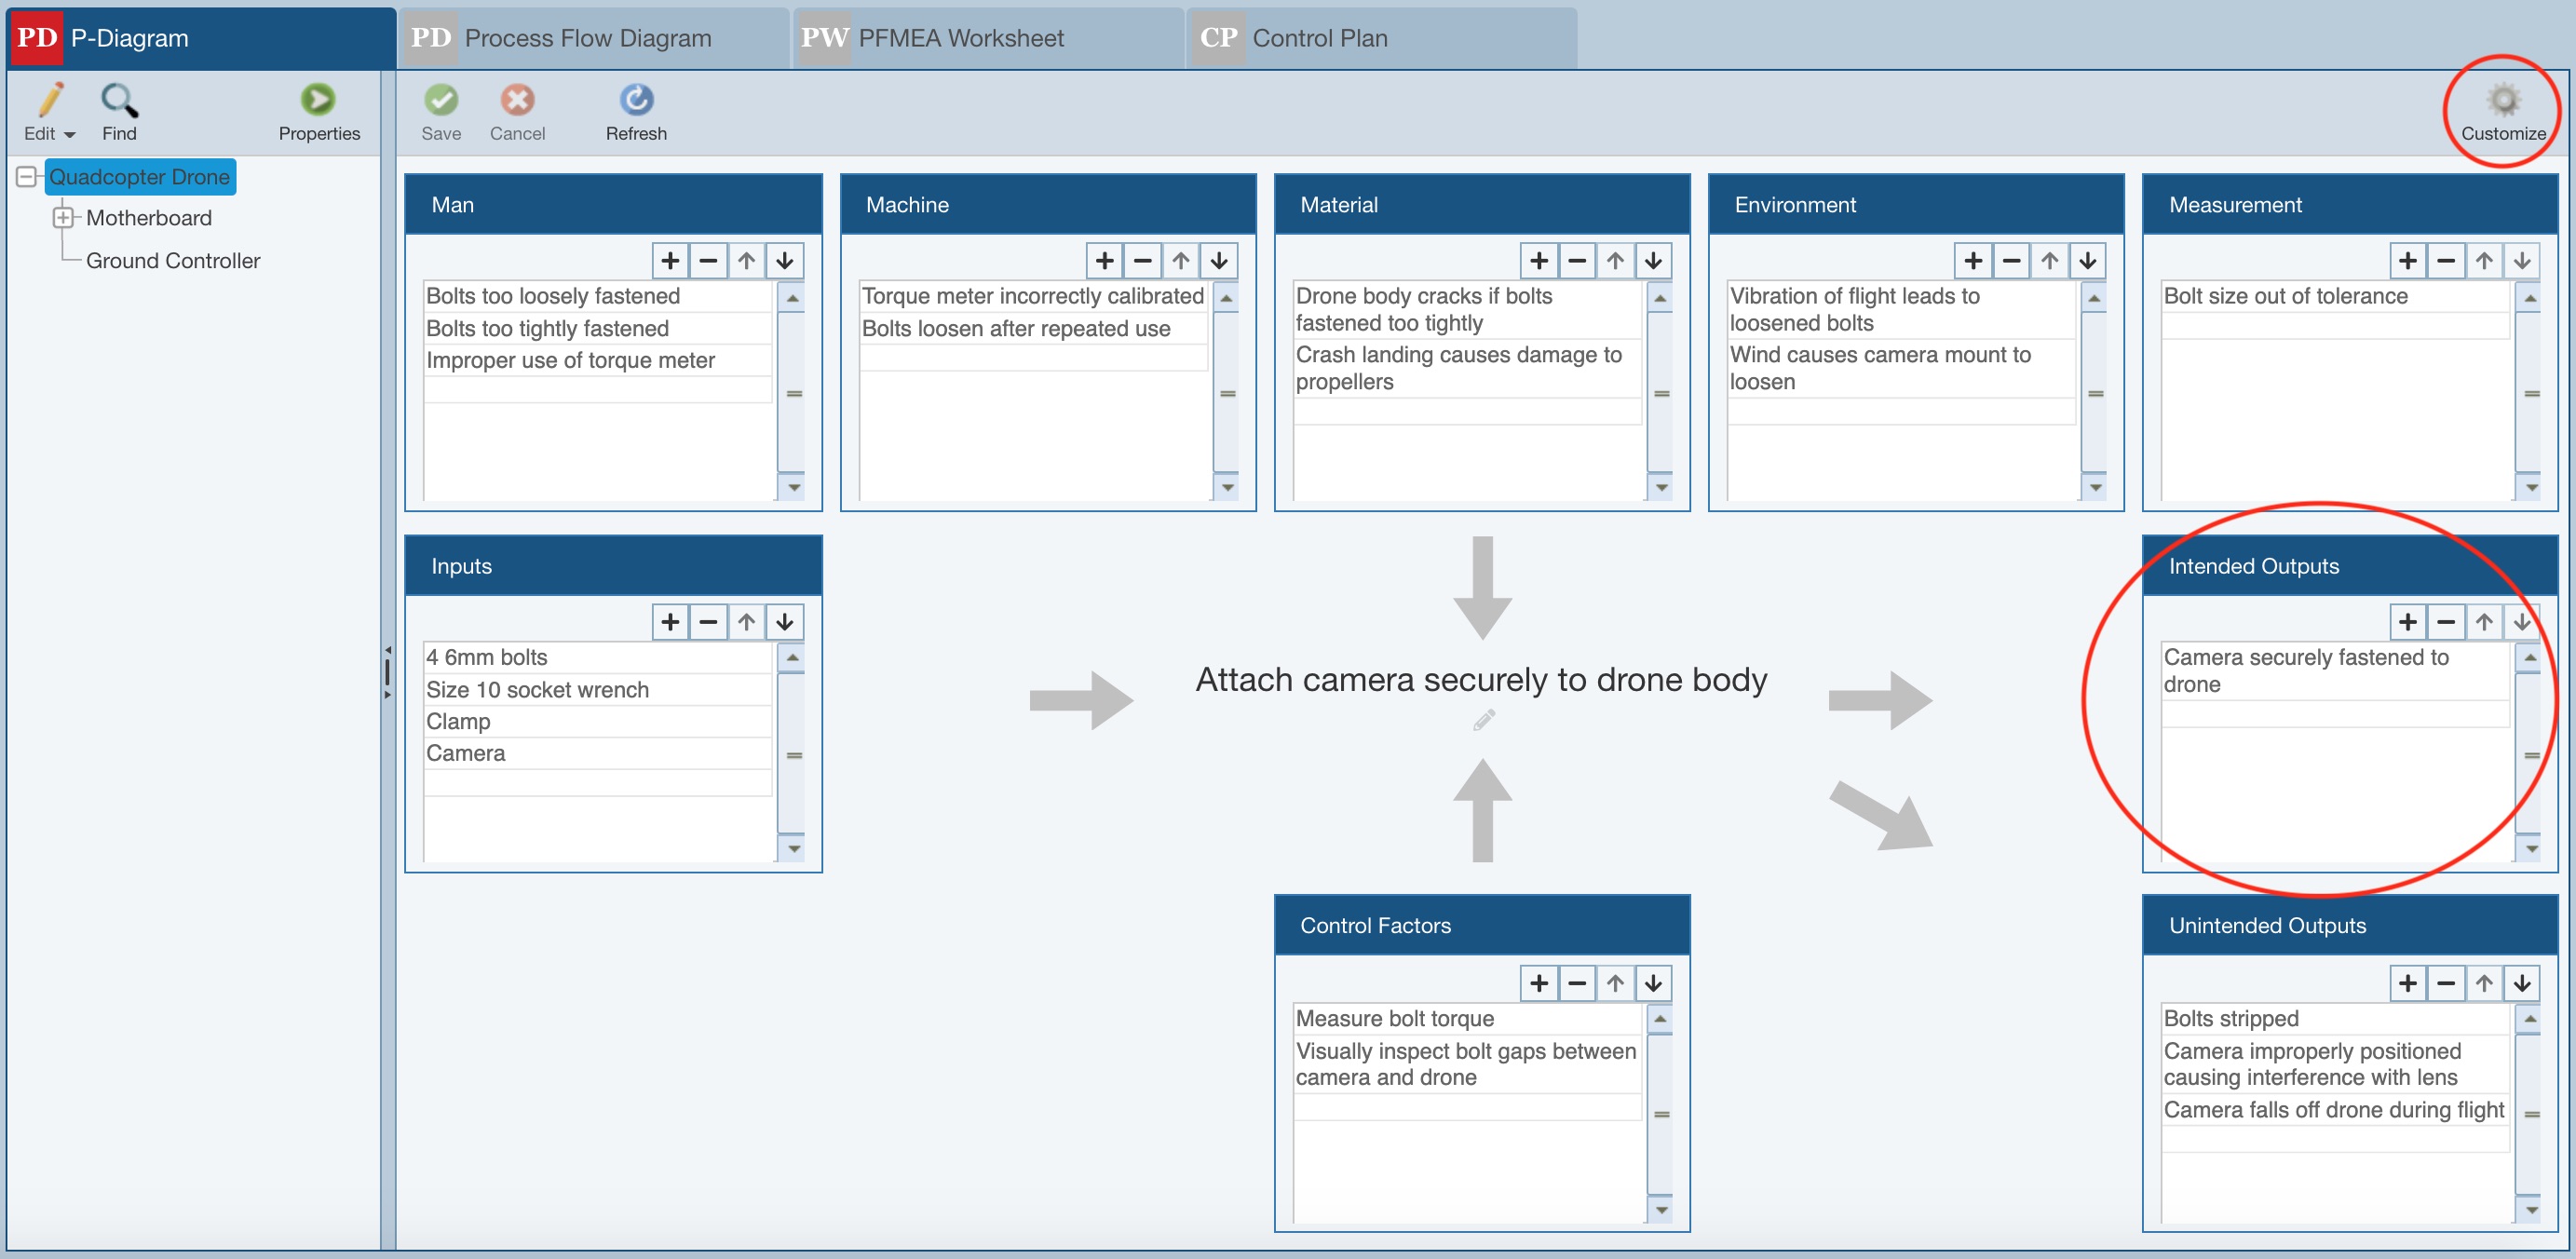
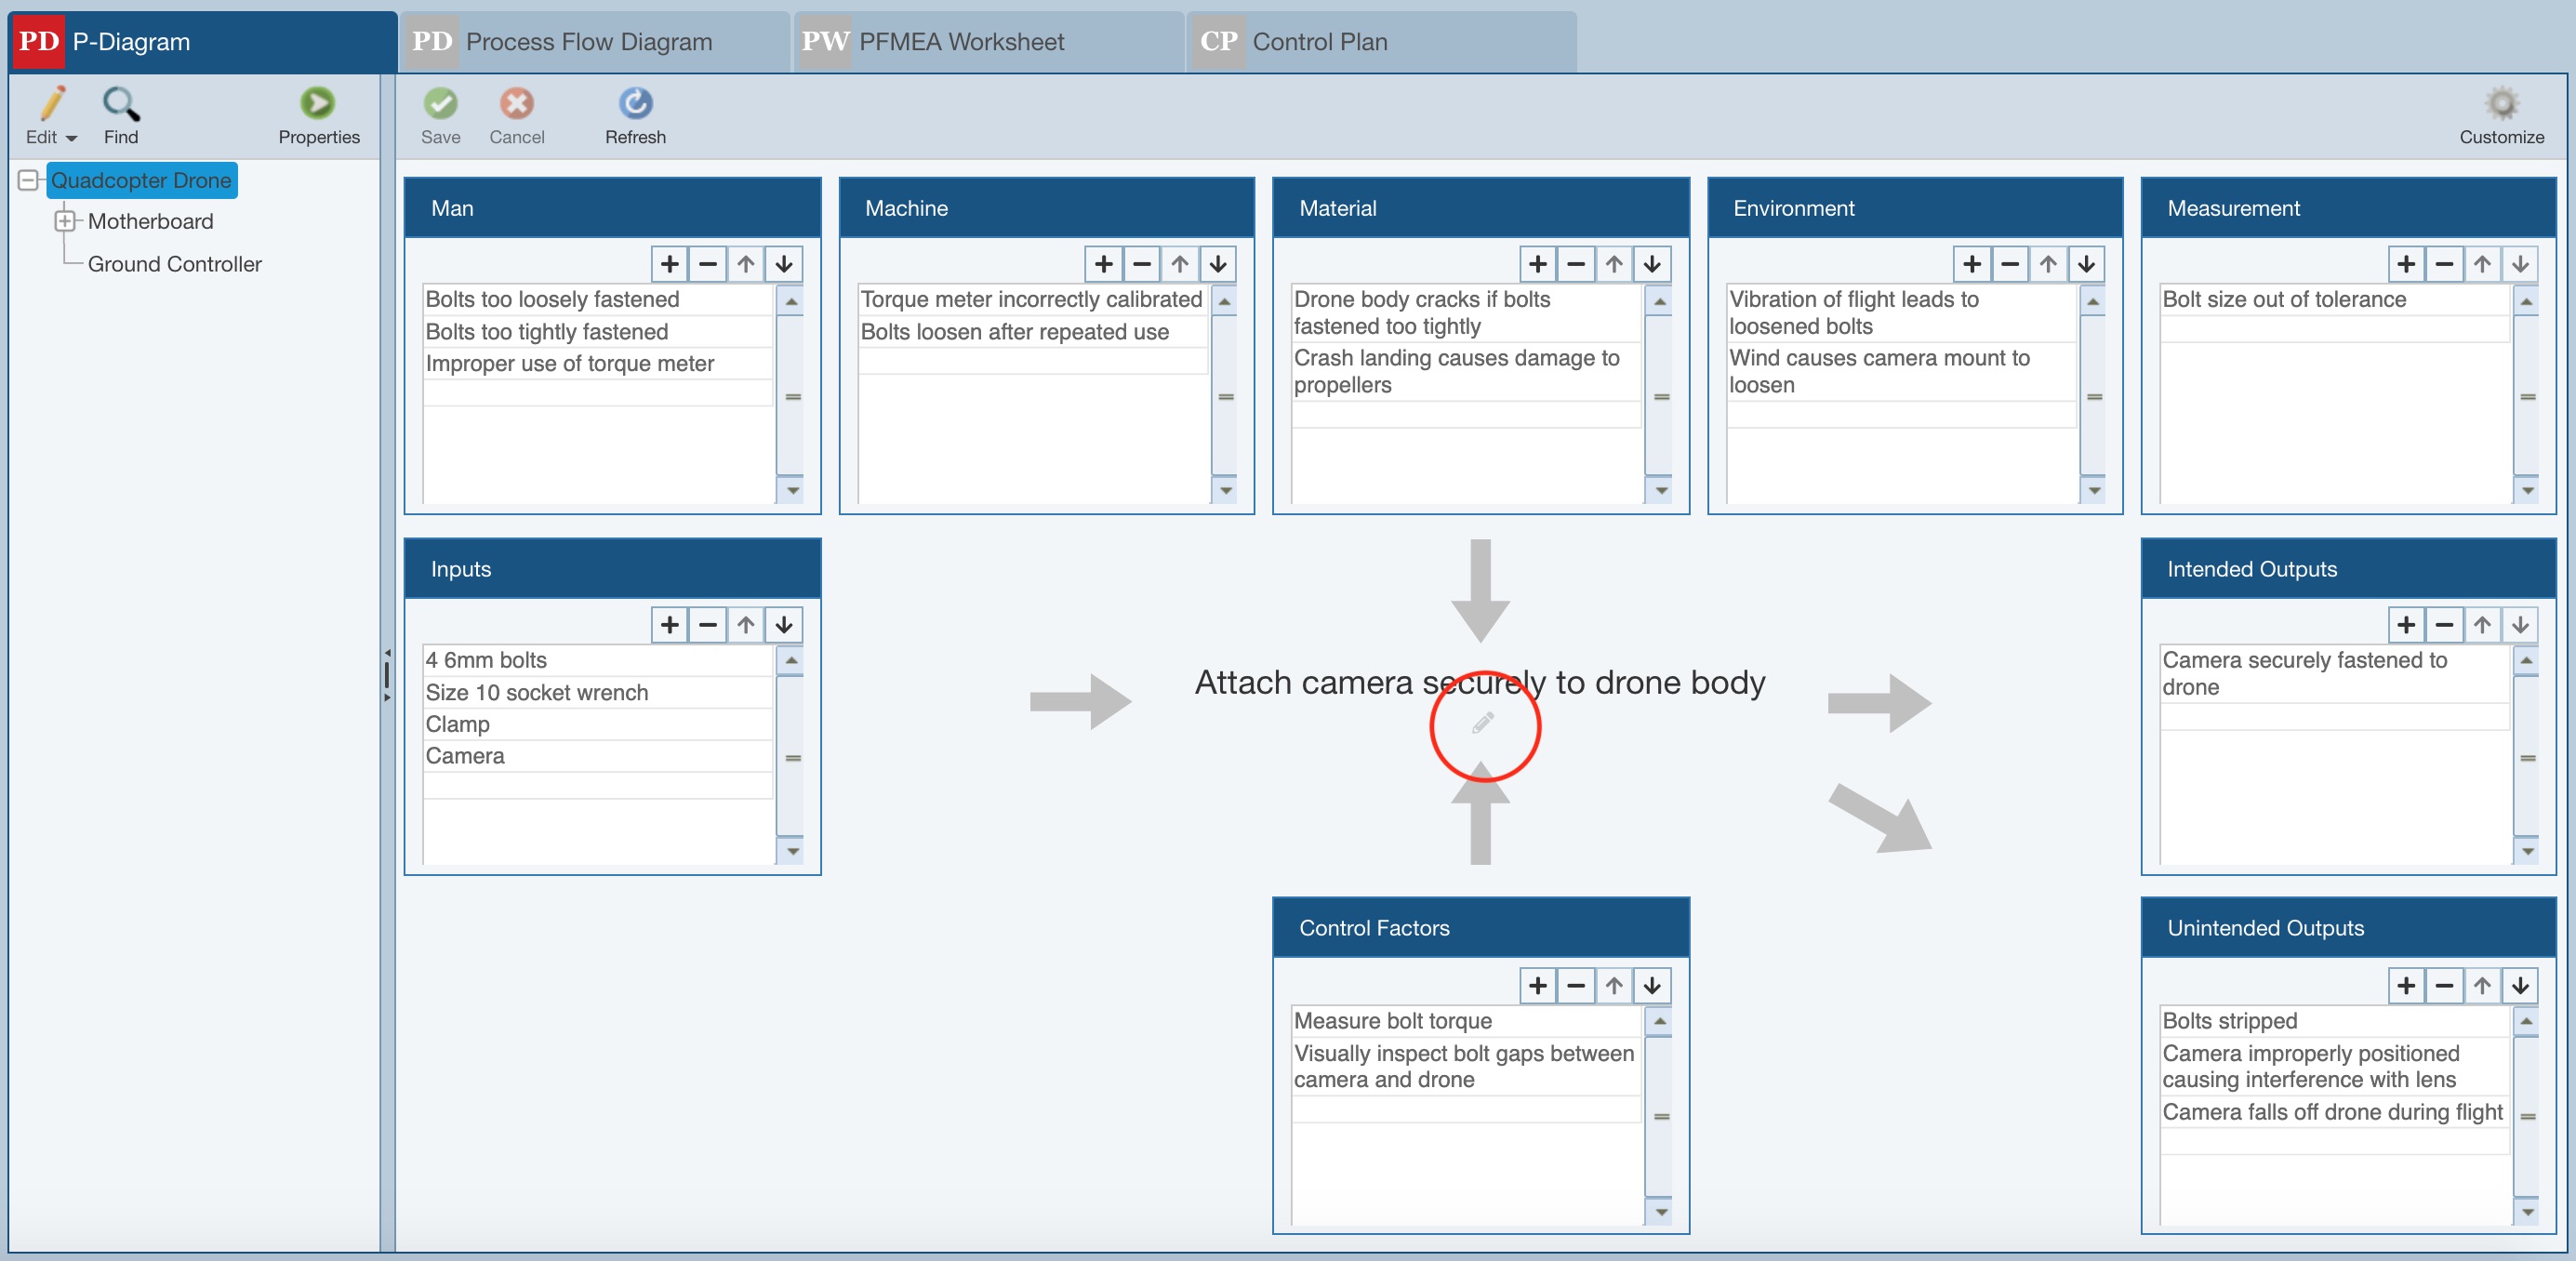
1. Click the P-Diagram tab to activate the P-Diagram Worksheet.

2. Review the elements of the P-Diagram. The elements are each of the boxes with the dark blue title bars. If you need to change any element titles, hide any elements or change any basic details about the P-Diagram format, click Customize.
3. Customize the P-Diagram worksheet, if needed.
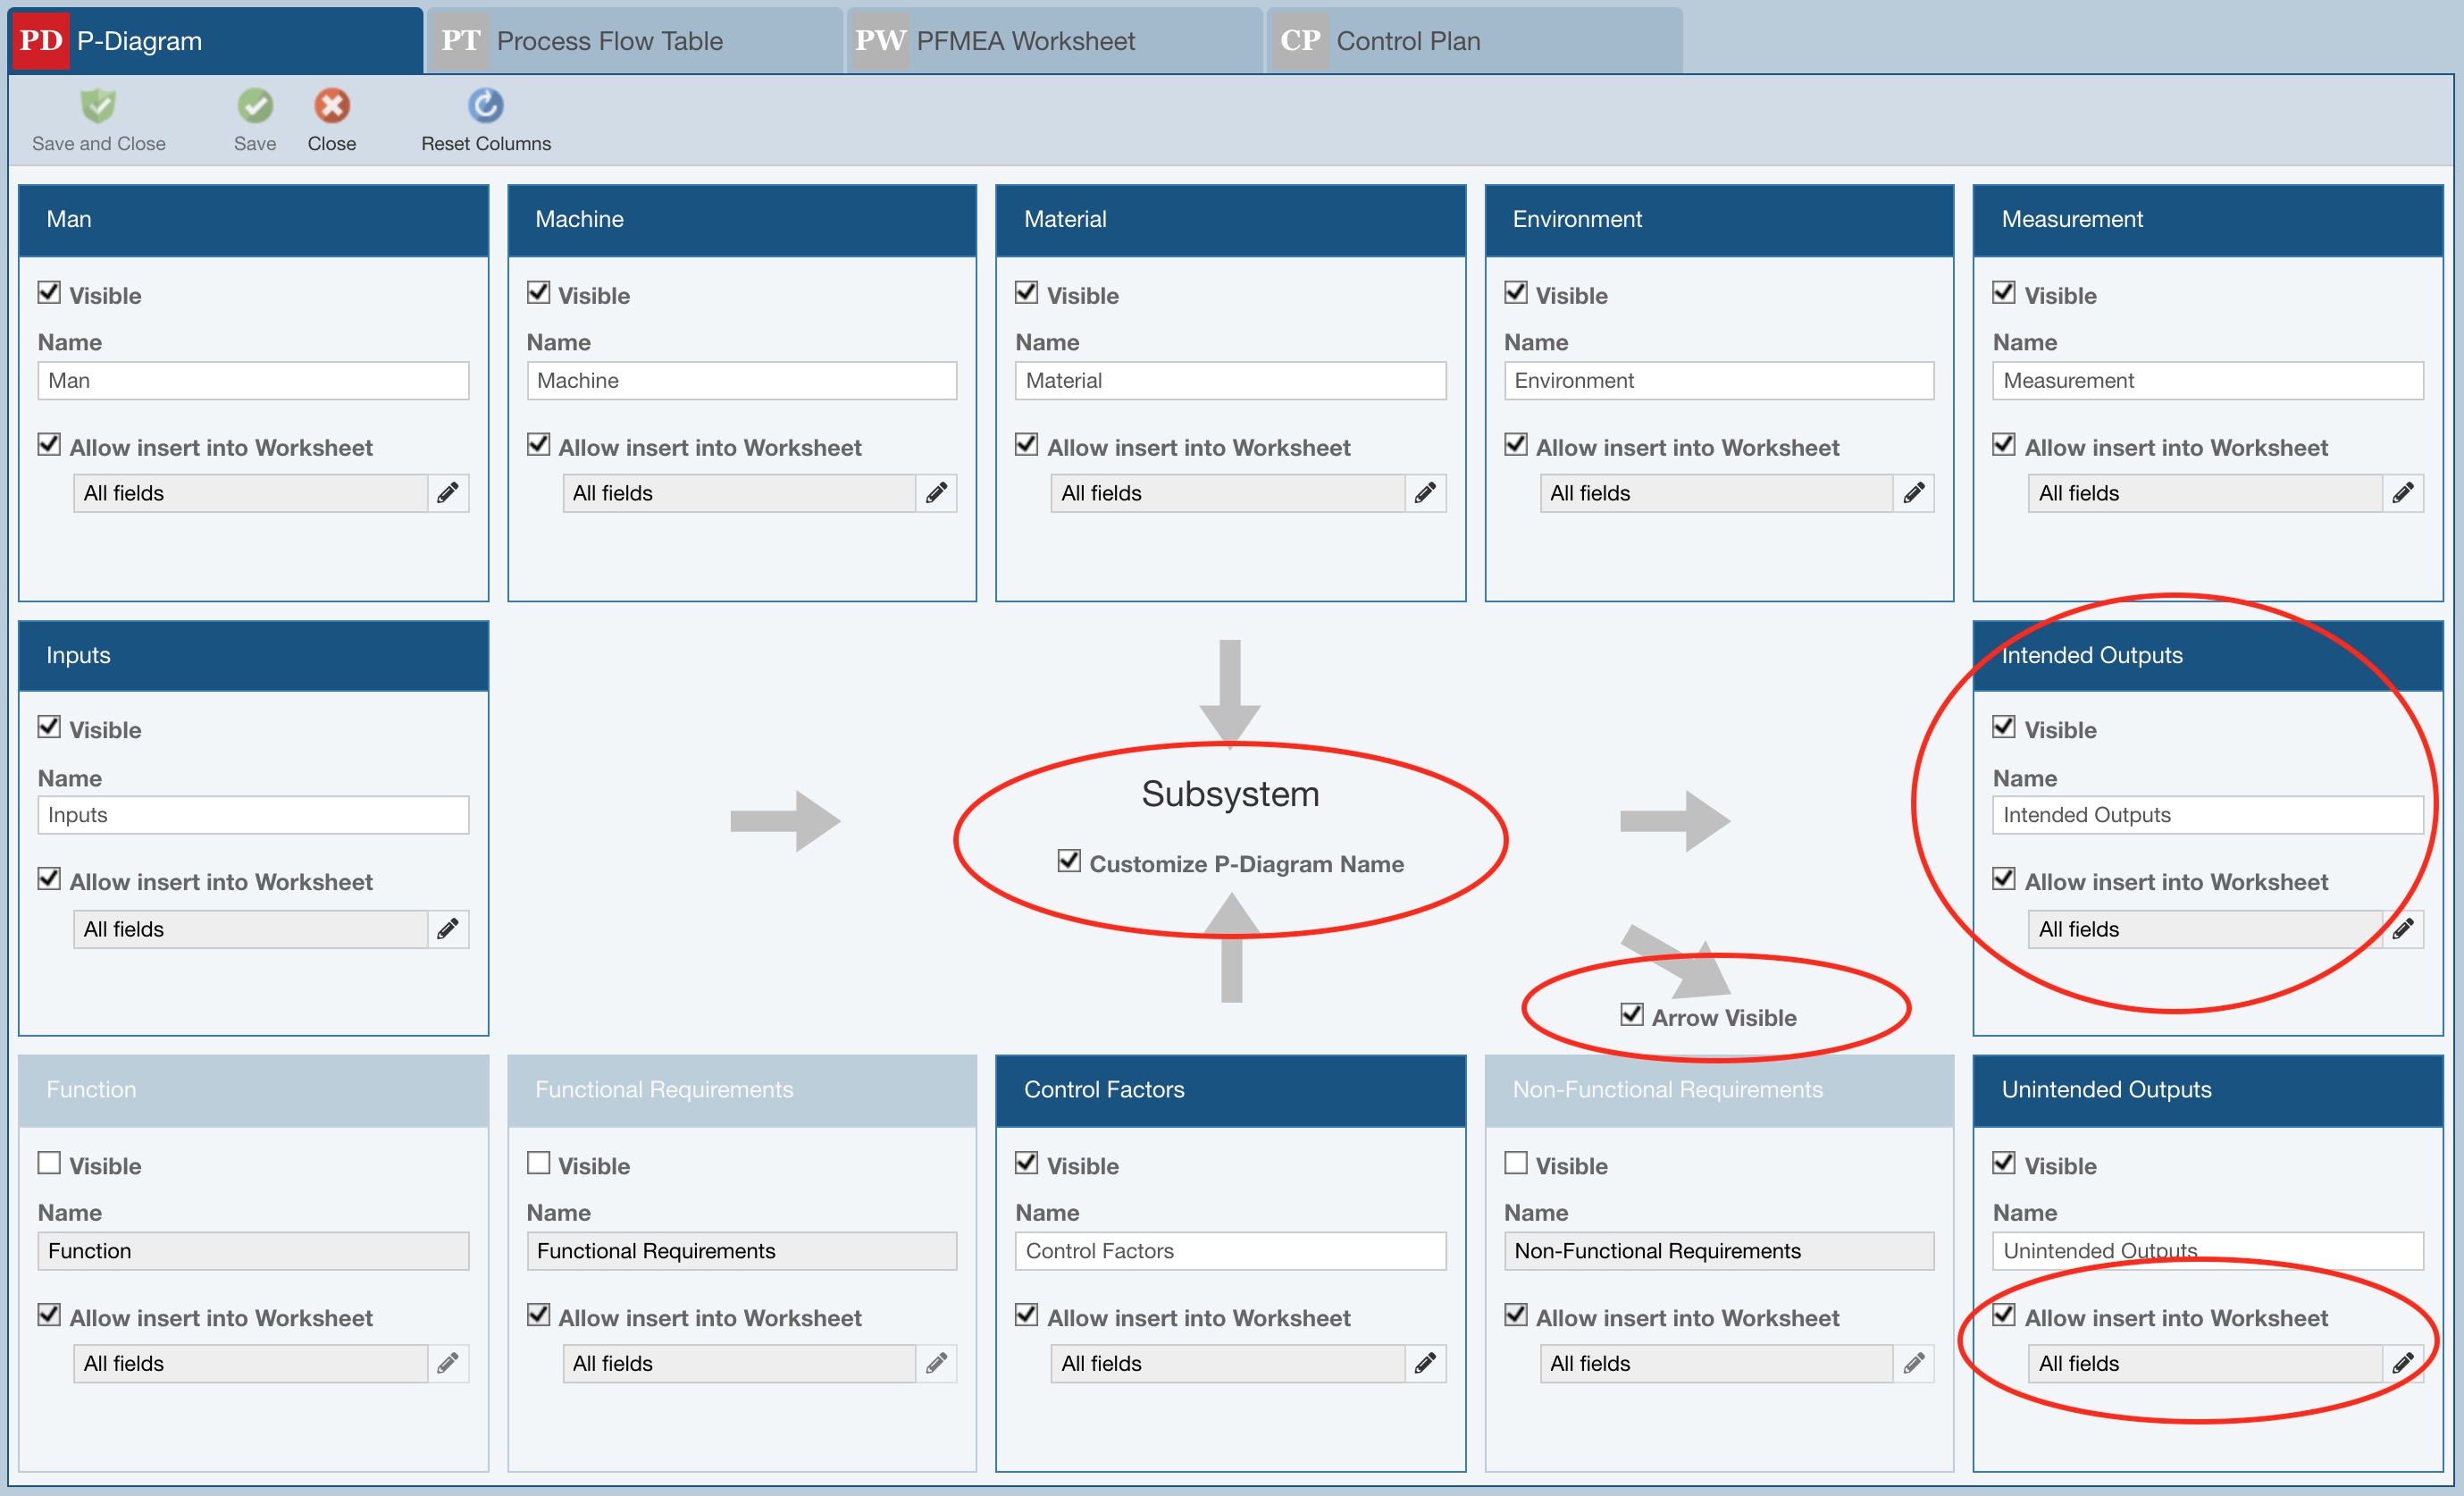
For each element, you can choose whether it will be visible on the worksheet using the Visible checkbox. You can also provide a custom Name for each element.
Additionally, you can use the Customize P-Diagram Name and Arrow Visible checkboxes to make final changes to the P-Diagram display.
When entering FMEA data, you can optionally insert P-Diagram data as described at the end of this section. You can control if data from an element can be inserted into the FMEA Worksheet using the Allow insert into Worksheet checkbox.
You can also specify which fields on the FMEA Worksheet can accept the data from the P-Diagram element using the control below the Allow insert into Worksheet checkbox.
Click the control button.
.jpg)
The Select Worksheet Fields dialog appears.
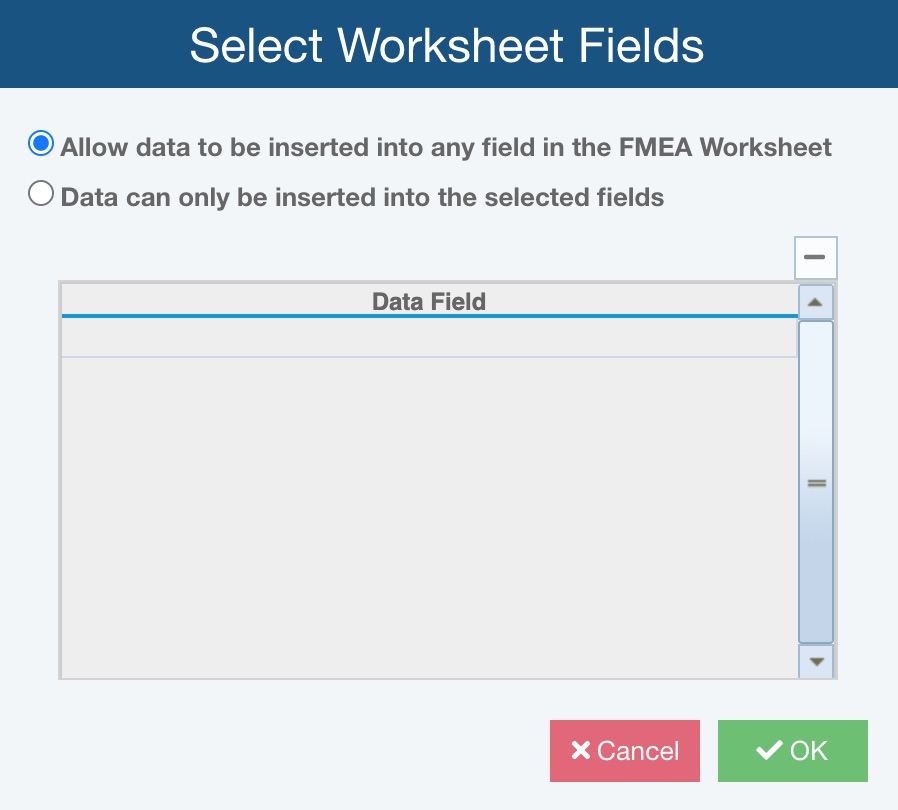
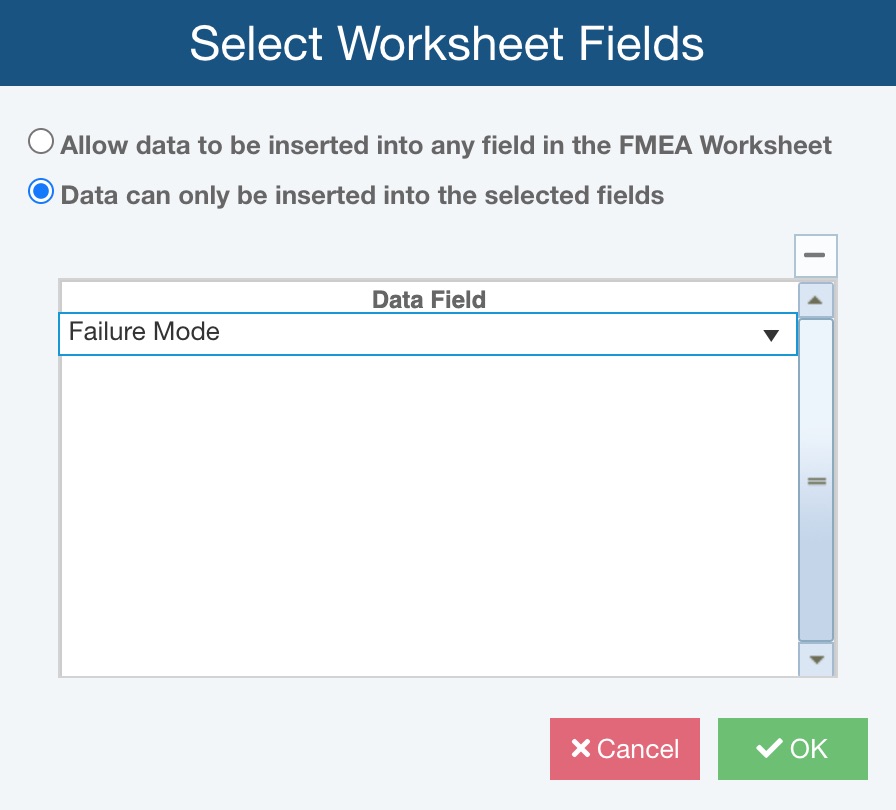
You can leave the default setting, Allow data to be inserted into any field in the FMEA Worksheet, or limit the fields by choosing Data can only be inserted into the selected fields. If you choose Data can only be inserted into the selected fields, use the dropdown list to choose the applicable FMEA fields where the data can be inserted.
The final step to customize the P-Diagram name is completed on the customized P-Diagram worksheet. When finished, click Close or Save and Close.
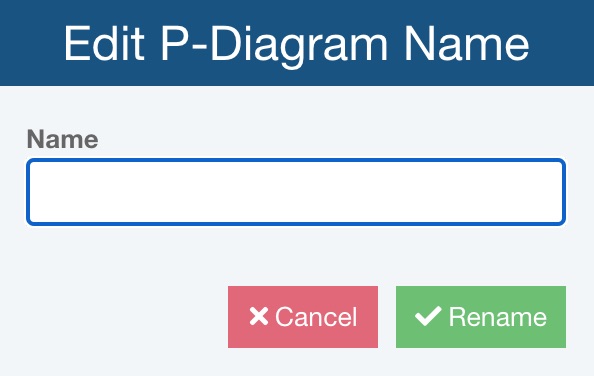
By default, the P-Diagram name is the same as the selected Subsystem Name. If you selected Customize P-Diagram Name, then a pencil icon will be available on the P-Diagram Worksheet to allow you to rename the P-Diagram.
To edit the name, click the pencil icon and on the Edit P-Diagram Name dialog, enter the preferred custom Name and click Rename.
4. For each element of the P-Diagram, add relevant content. Click in the empty row at the bottom of any element table and type to enter content and press Tab or Enter to complete it. Use the element toolbar buttons to delete or to move content up or down.
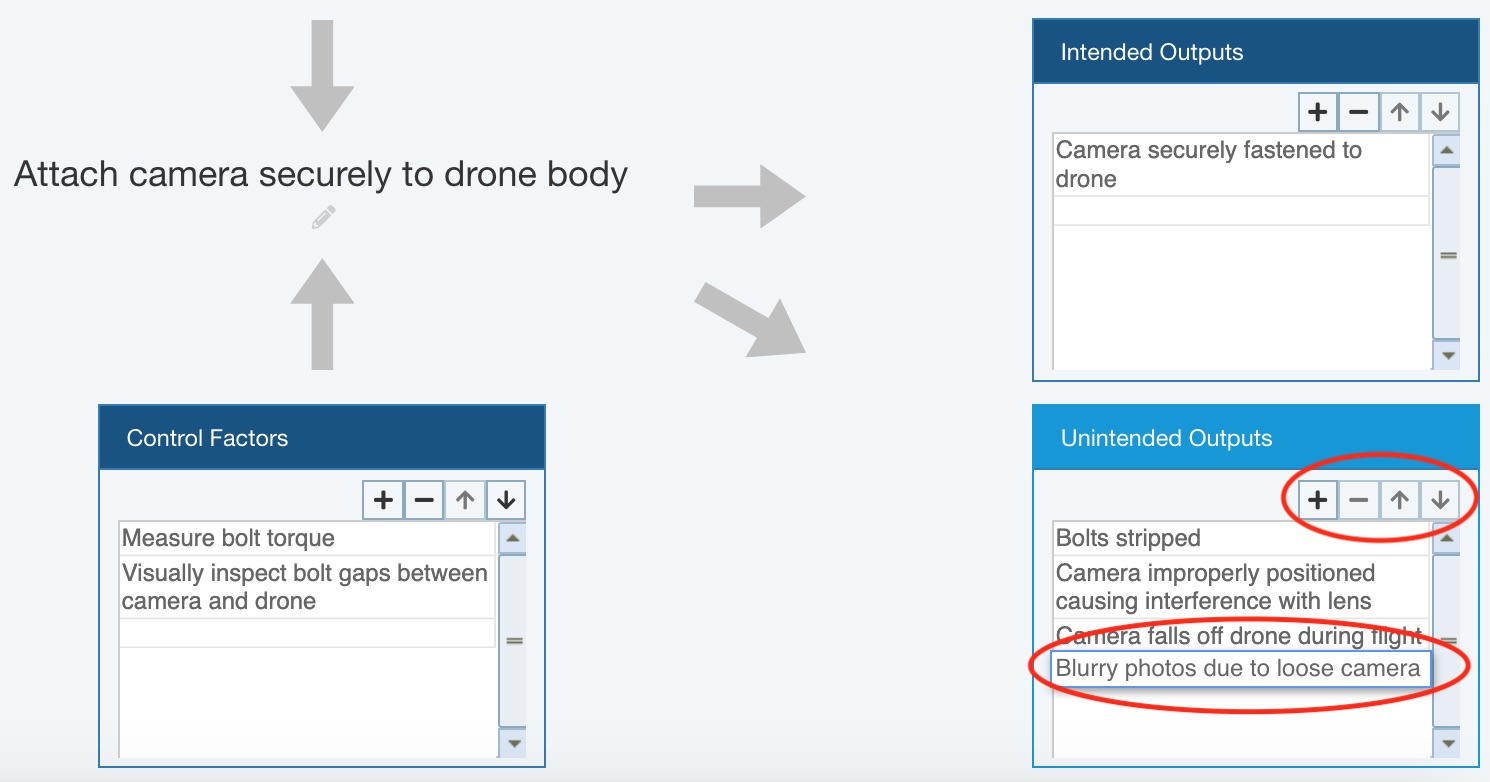
5. Any newly added P-Diagram content will show the red mark in the upper left corner, which indicates that the data in the field has not yet been saved. To save content, click Save in the P-Diagram worksheet toolbar.
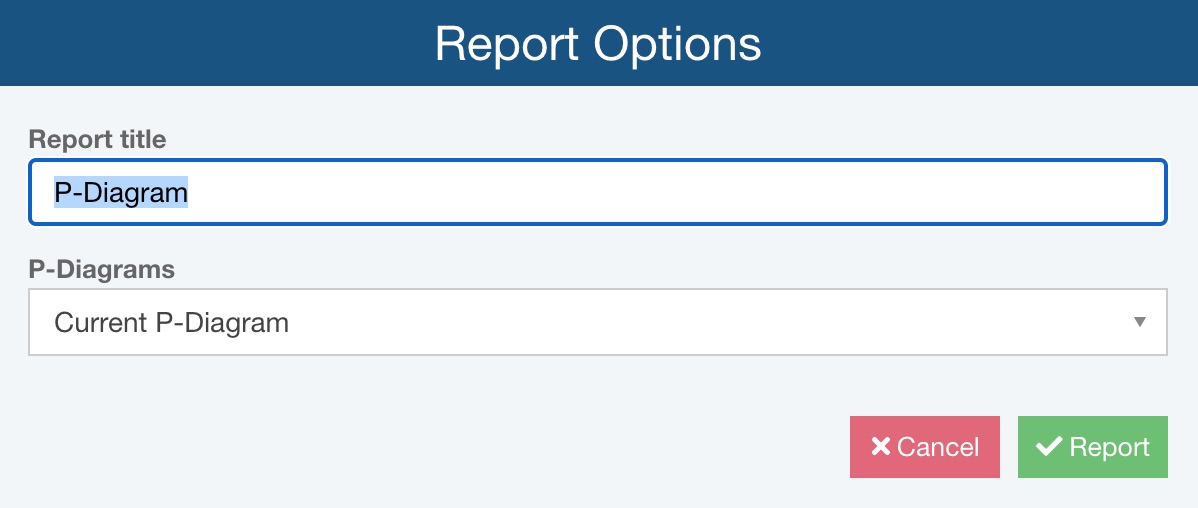
6. If you wish to print the P-Diagram, click Report in the sidebar.
.jpg)
The Report Options dialog appears. Confirm or enter the Report title and P-Diagrams and click Report.
The P-Diagram report appears in a new browser tab. Review, save or print the report and close the report tab when finished.
Note that you can use the P-Diagram data to help streamline data entry on your FMEA Worksheet.
1. Select a cell in the column where you would like to add new data from the P-Diagram. For example, to enter a new Failure Mode into your FMEA Worksheet, select a cell in the Failure Mode column.
2. In the toolbar, click Insert and then P-Diagram Data.
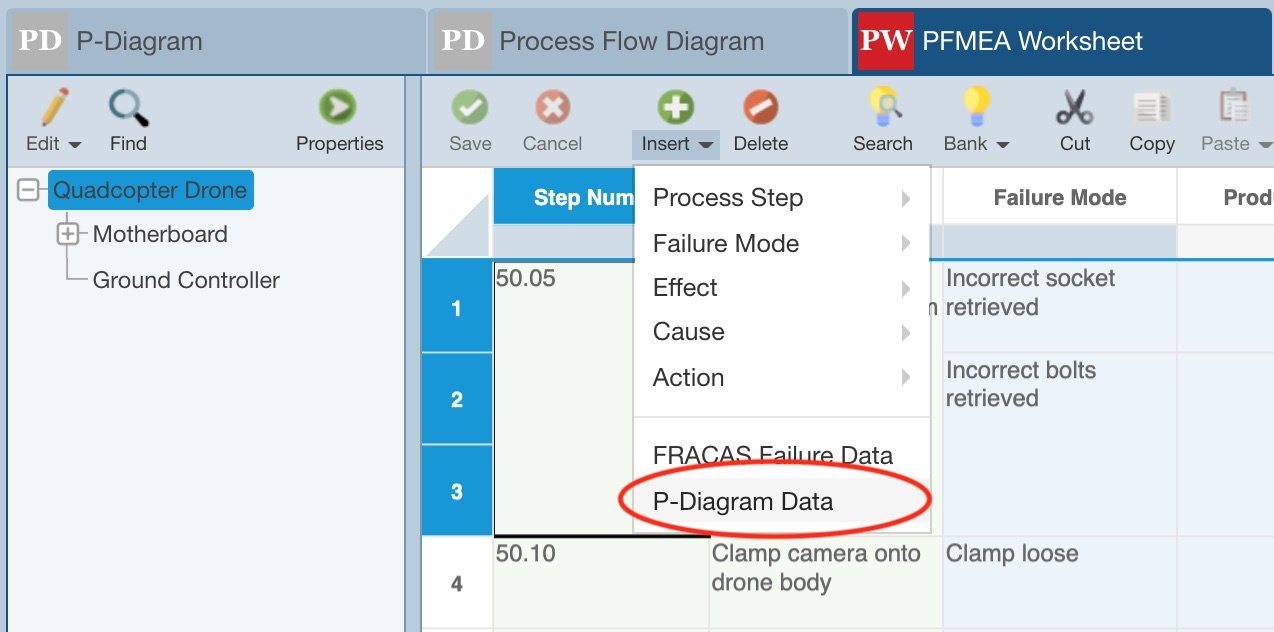
The Insert from P-Diagram dialog appears.
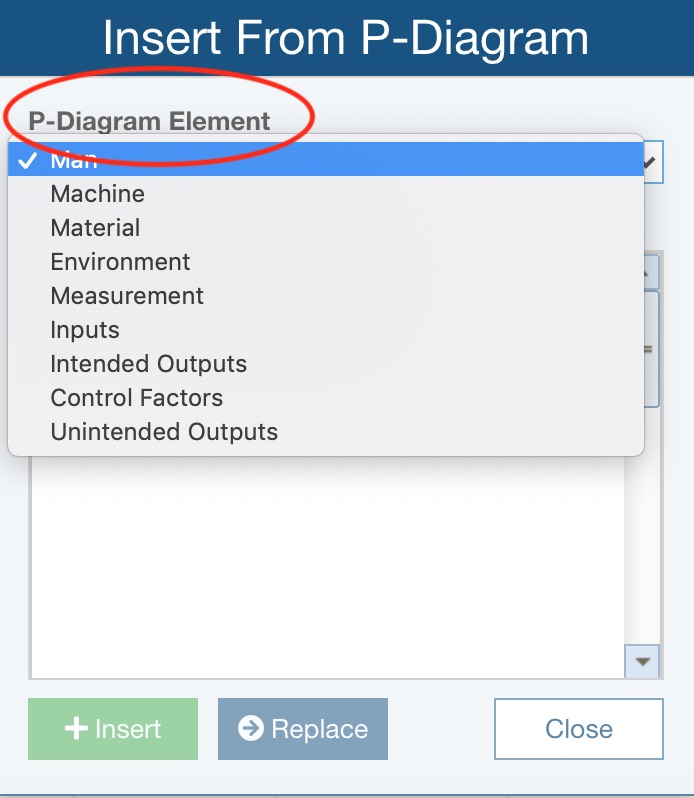
3. Select the appropriate P-Diagram Element. Available P-Diagram Element choices are based on the P-Diagram customization described above; only those marked with Allow insert into Worksheet will be shown in the list. Also, if the data for any of the P-Diagram Elements is set to be inserted to only specified fields, a Limited Insert warning will appear and indicate to which FMEA Worksheet fields the P-Diagram Element data can be inserted.
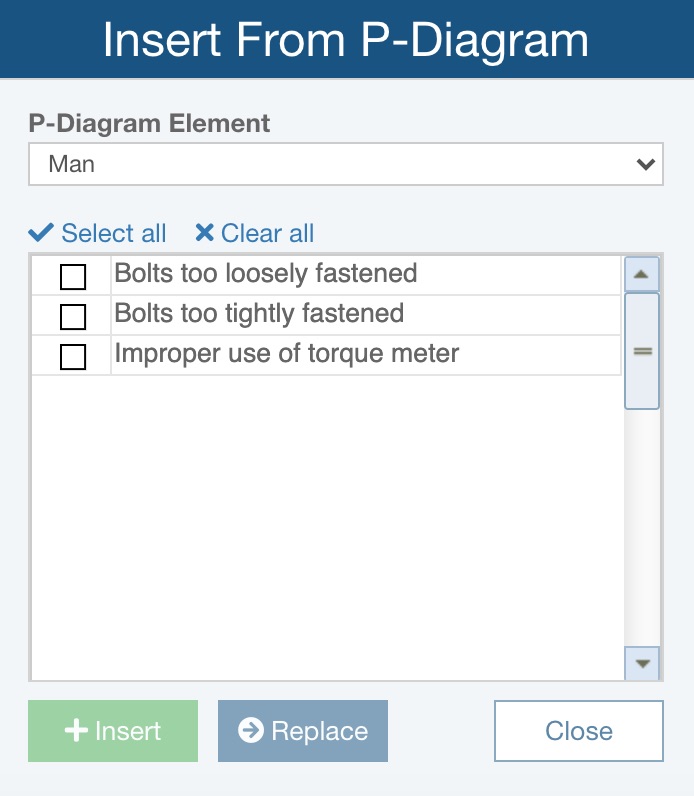
4. Click to select one or more rows containing the data to be added.
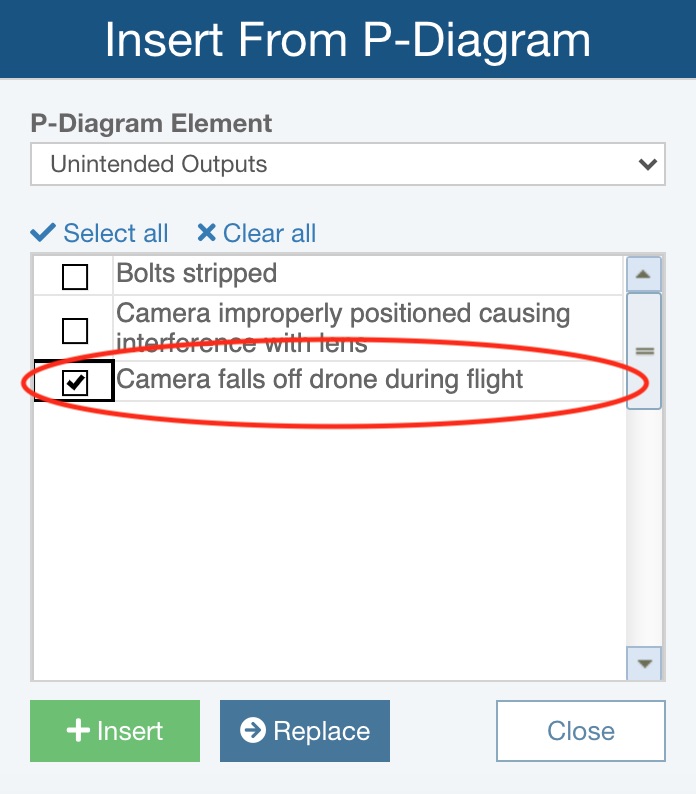
5. Click Insert to add a new record or Replace to replace the existing record.
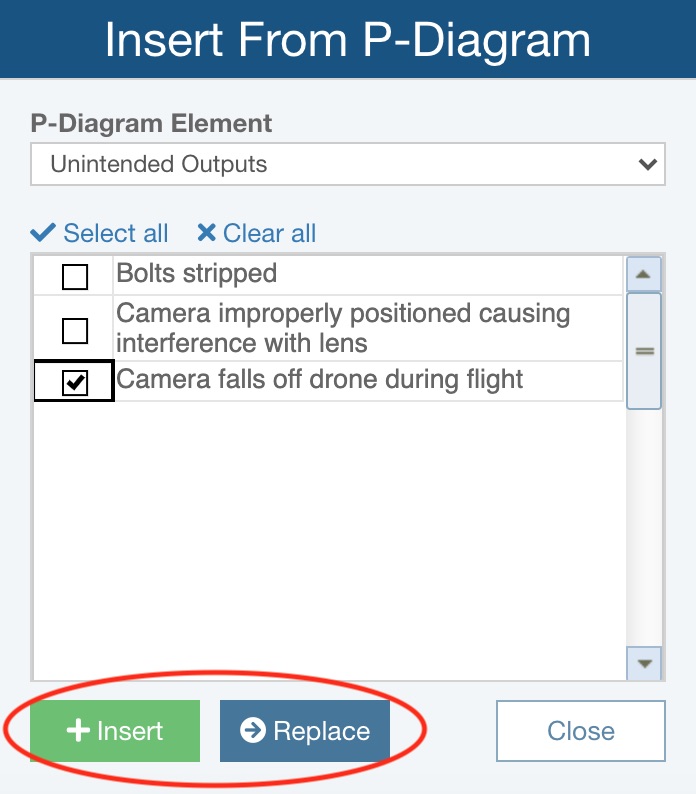
Note that if Insert and Replace are both disabled, it indicates that you cannot add the type of P-Diagram data to the FMEA Worksheet field selected. Any such limitations are specified when customizing the P-Diagram, as described above. If there are any such limitations, details can be confirmed by hovering the cursor over the information icon.
Step 3: Create a Process Flow Diagram (PFD)
PFMEAs may also include a Process Flow Diagram (PFD). The PFD describes your process in a detailed step-by-step manner. Developing a well-defined PFD can be the basis for comprehensive and effective PFMEAs.
The PFD defines what product requirements, or characteristics, your process affects and how those characteristics are controlled to ensure that product requirements are met. The product characteristics are the outputs of your process, and the controls are the inputs used to maintain quality.
The following steps are used to create your PFD:
- Define your PFD by listing out in detail all the steps of your process in a sequential fashion. Each step is given a Step Number with which to identify the step in the process. In Relyence FMEA, your process steps can be entered in the PFD, your PFMEA Worksheet, or your CP. Wherever you enter process step numbers and descriptions, they are automatically kept in sync across the three elements of your PFMEA. Typically, a PFMEA is started with the definition of the process flow, so it is common to use the PFD to enter your process steps.
- Describe the particular step in text.
- Define the type of action of each step in your process using one of these standard PFMEA designations: Fabrication (creation, work), Move (physically move an item from one location to another), Store/Get (retrieve or obtain a tool or part), Inspect (inspect in one of four ways - automatically, manually, visually, or by quality audit), Rework (redo work to correct an issue), or Scrap/Contain (scrap material).
- For the steps in your process that correlate to specific PFMEA Product Characteristics, enter these in your PFD. Number your PFMEA Product Characteristics, if desired. You can enter multiple PFMEA Product Characteristics by clicking Insert from the toolbar while on any PFMEA Product Characteristic field. Note that the PFMEA Product Characteristic can be entered based on data in the Product Characteristic table, so you can choose existing PFMEA Product Characteristics from the choice list; or if you need to enter new PFMEA Product Characteristic data, click Add new... and the cursor appears and you can enter a new value for the Characteristic field, which is stored in the Product Characteristic table. Note that you can access the Product Characteristics table from the Sidebar by clicking Configure>FMEA>Product Characteristics.
- If you use Classifications for your key product characteristics (KPC), assign the Class to your PFMEA Product Characteristic.
- For the steps in your process that correlate to specific PFMEA Process Characteristics, designate those in your PFD. Number your PFMEA Process Characteristic if desired. You can enter multiple PFMEA Process Characteristics by clicking Insert from the toolbar while on any PMEA Process Characteristic field.
- If you classify your key process characteristics (KCC), assign the appropriate Class to your PFMEA Process Characteristic.
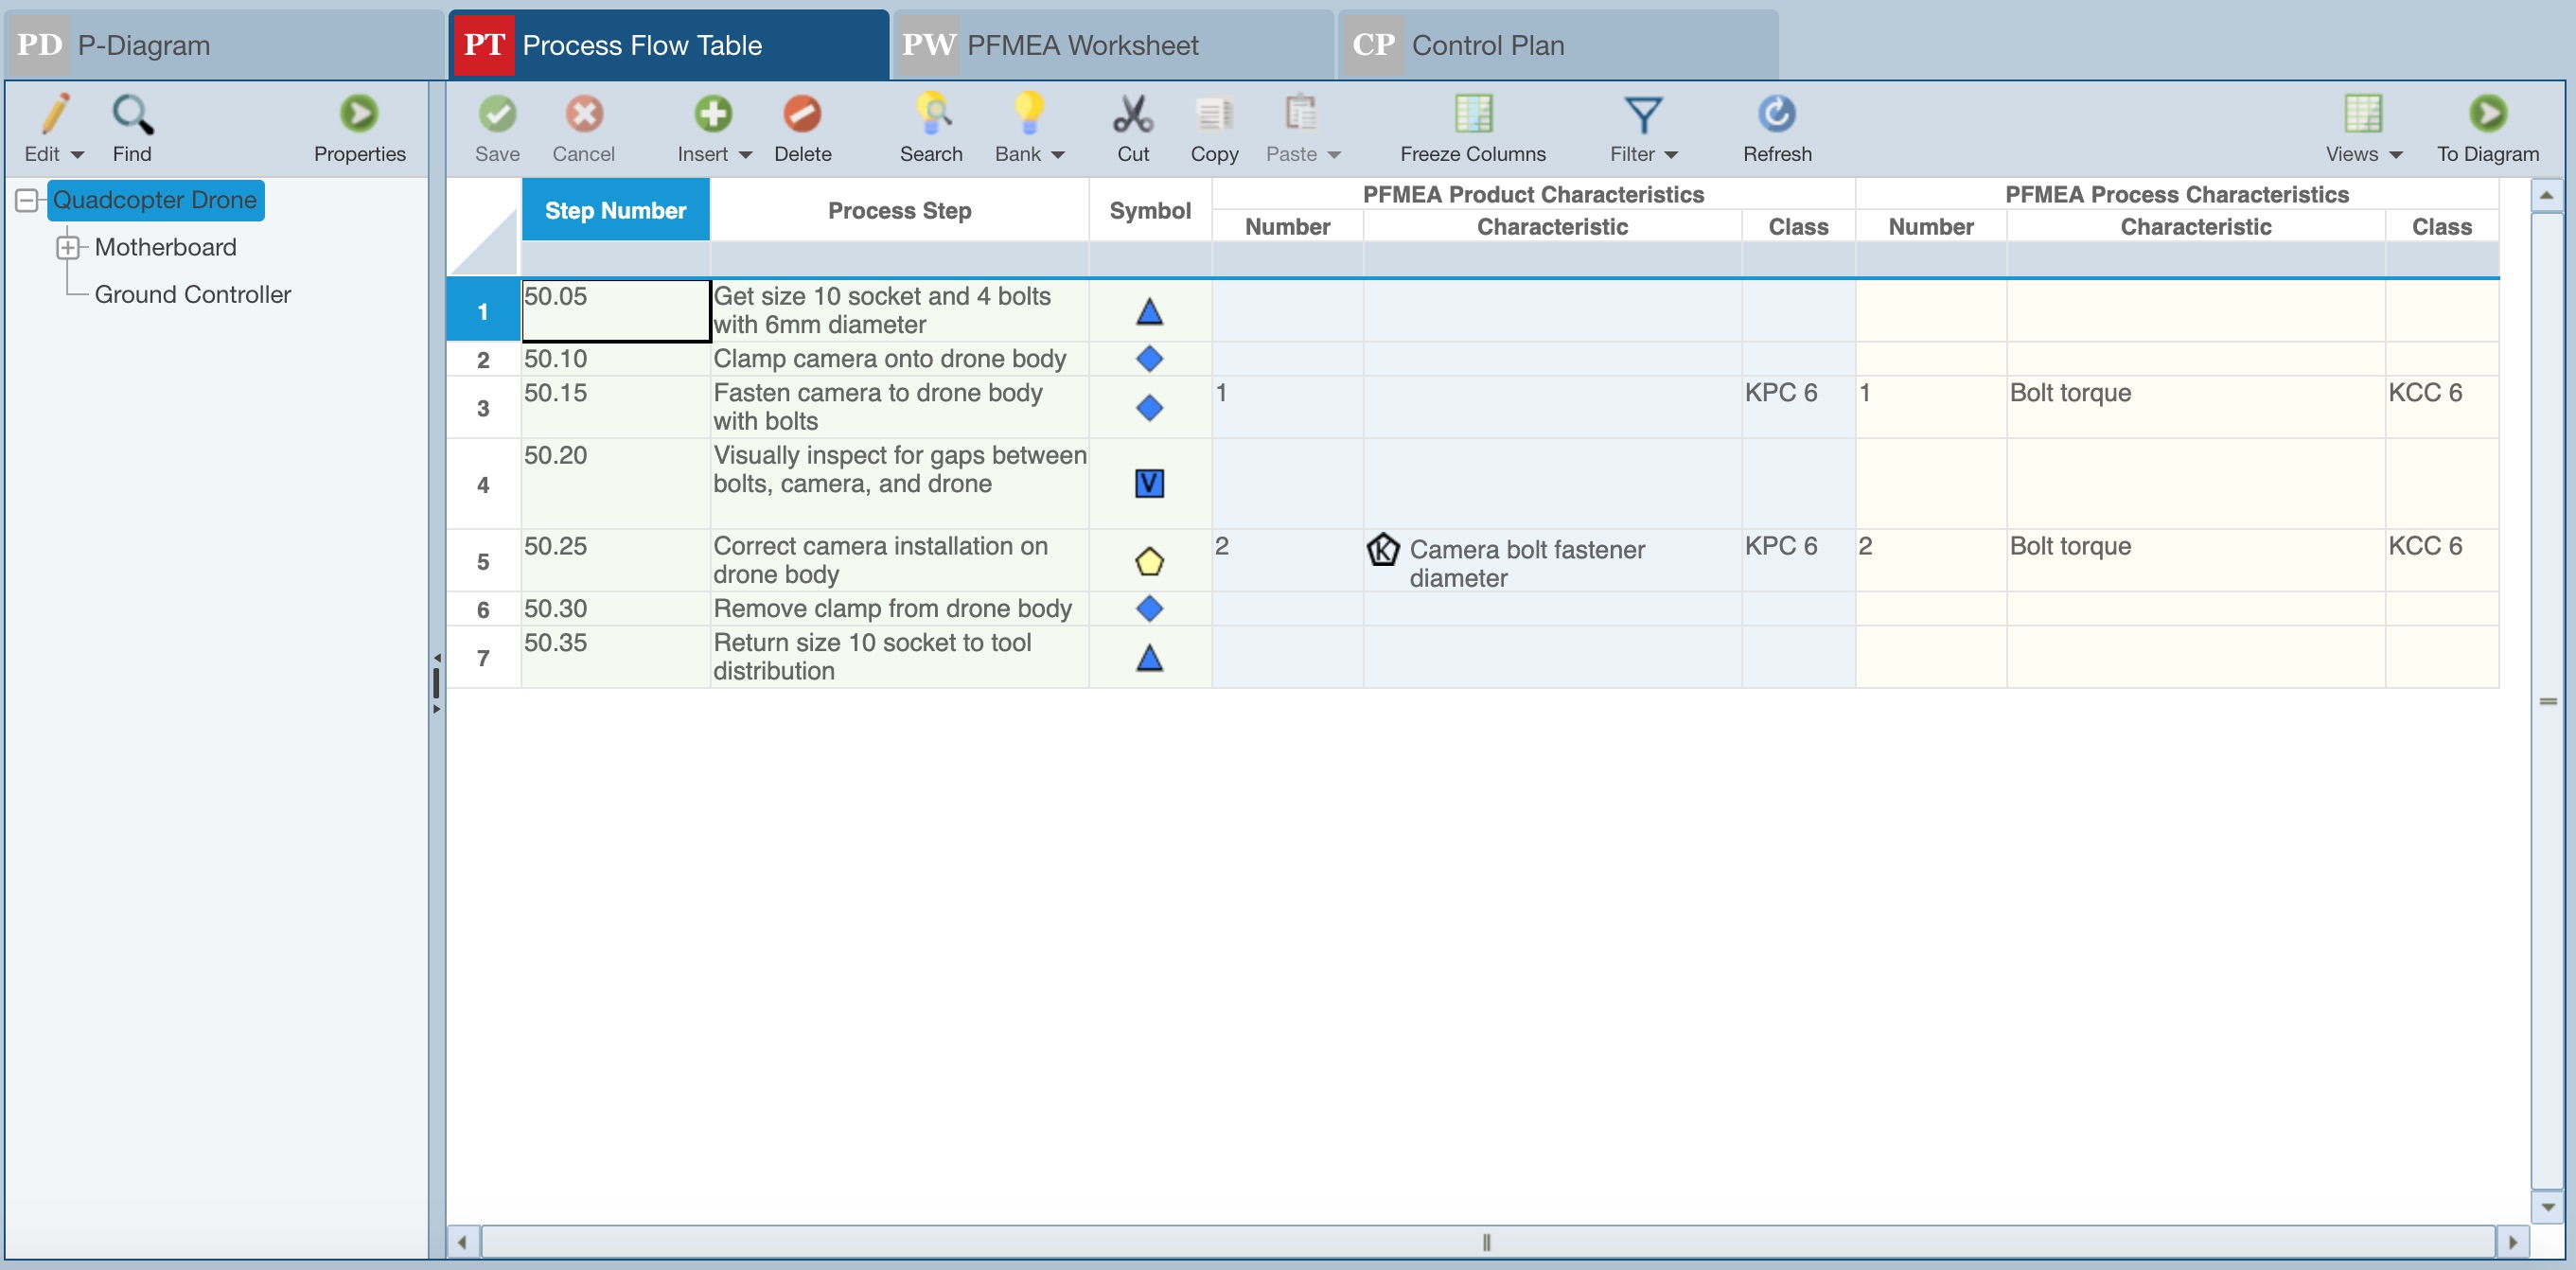
In Relyence FMEA, you can enter your process flow information using the Process Flow Table (PFT) view or in the Process Flow Diagram (PFD) view. Or, you can use both in conjunction to create your process flow diagram.
The Process Flow Table view shows a Worksheet, or table, type view of your data.
Alternatively, or in addition to the PFT, you can use the Process Flow Diagram (PFD) view to create a graphical representation of your process flow. To view the Process Flow as a Diagram, click the To Diagram button in the upper right of the toolbar.
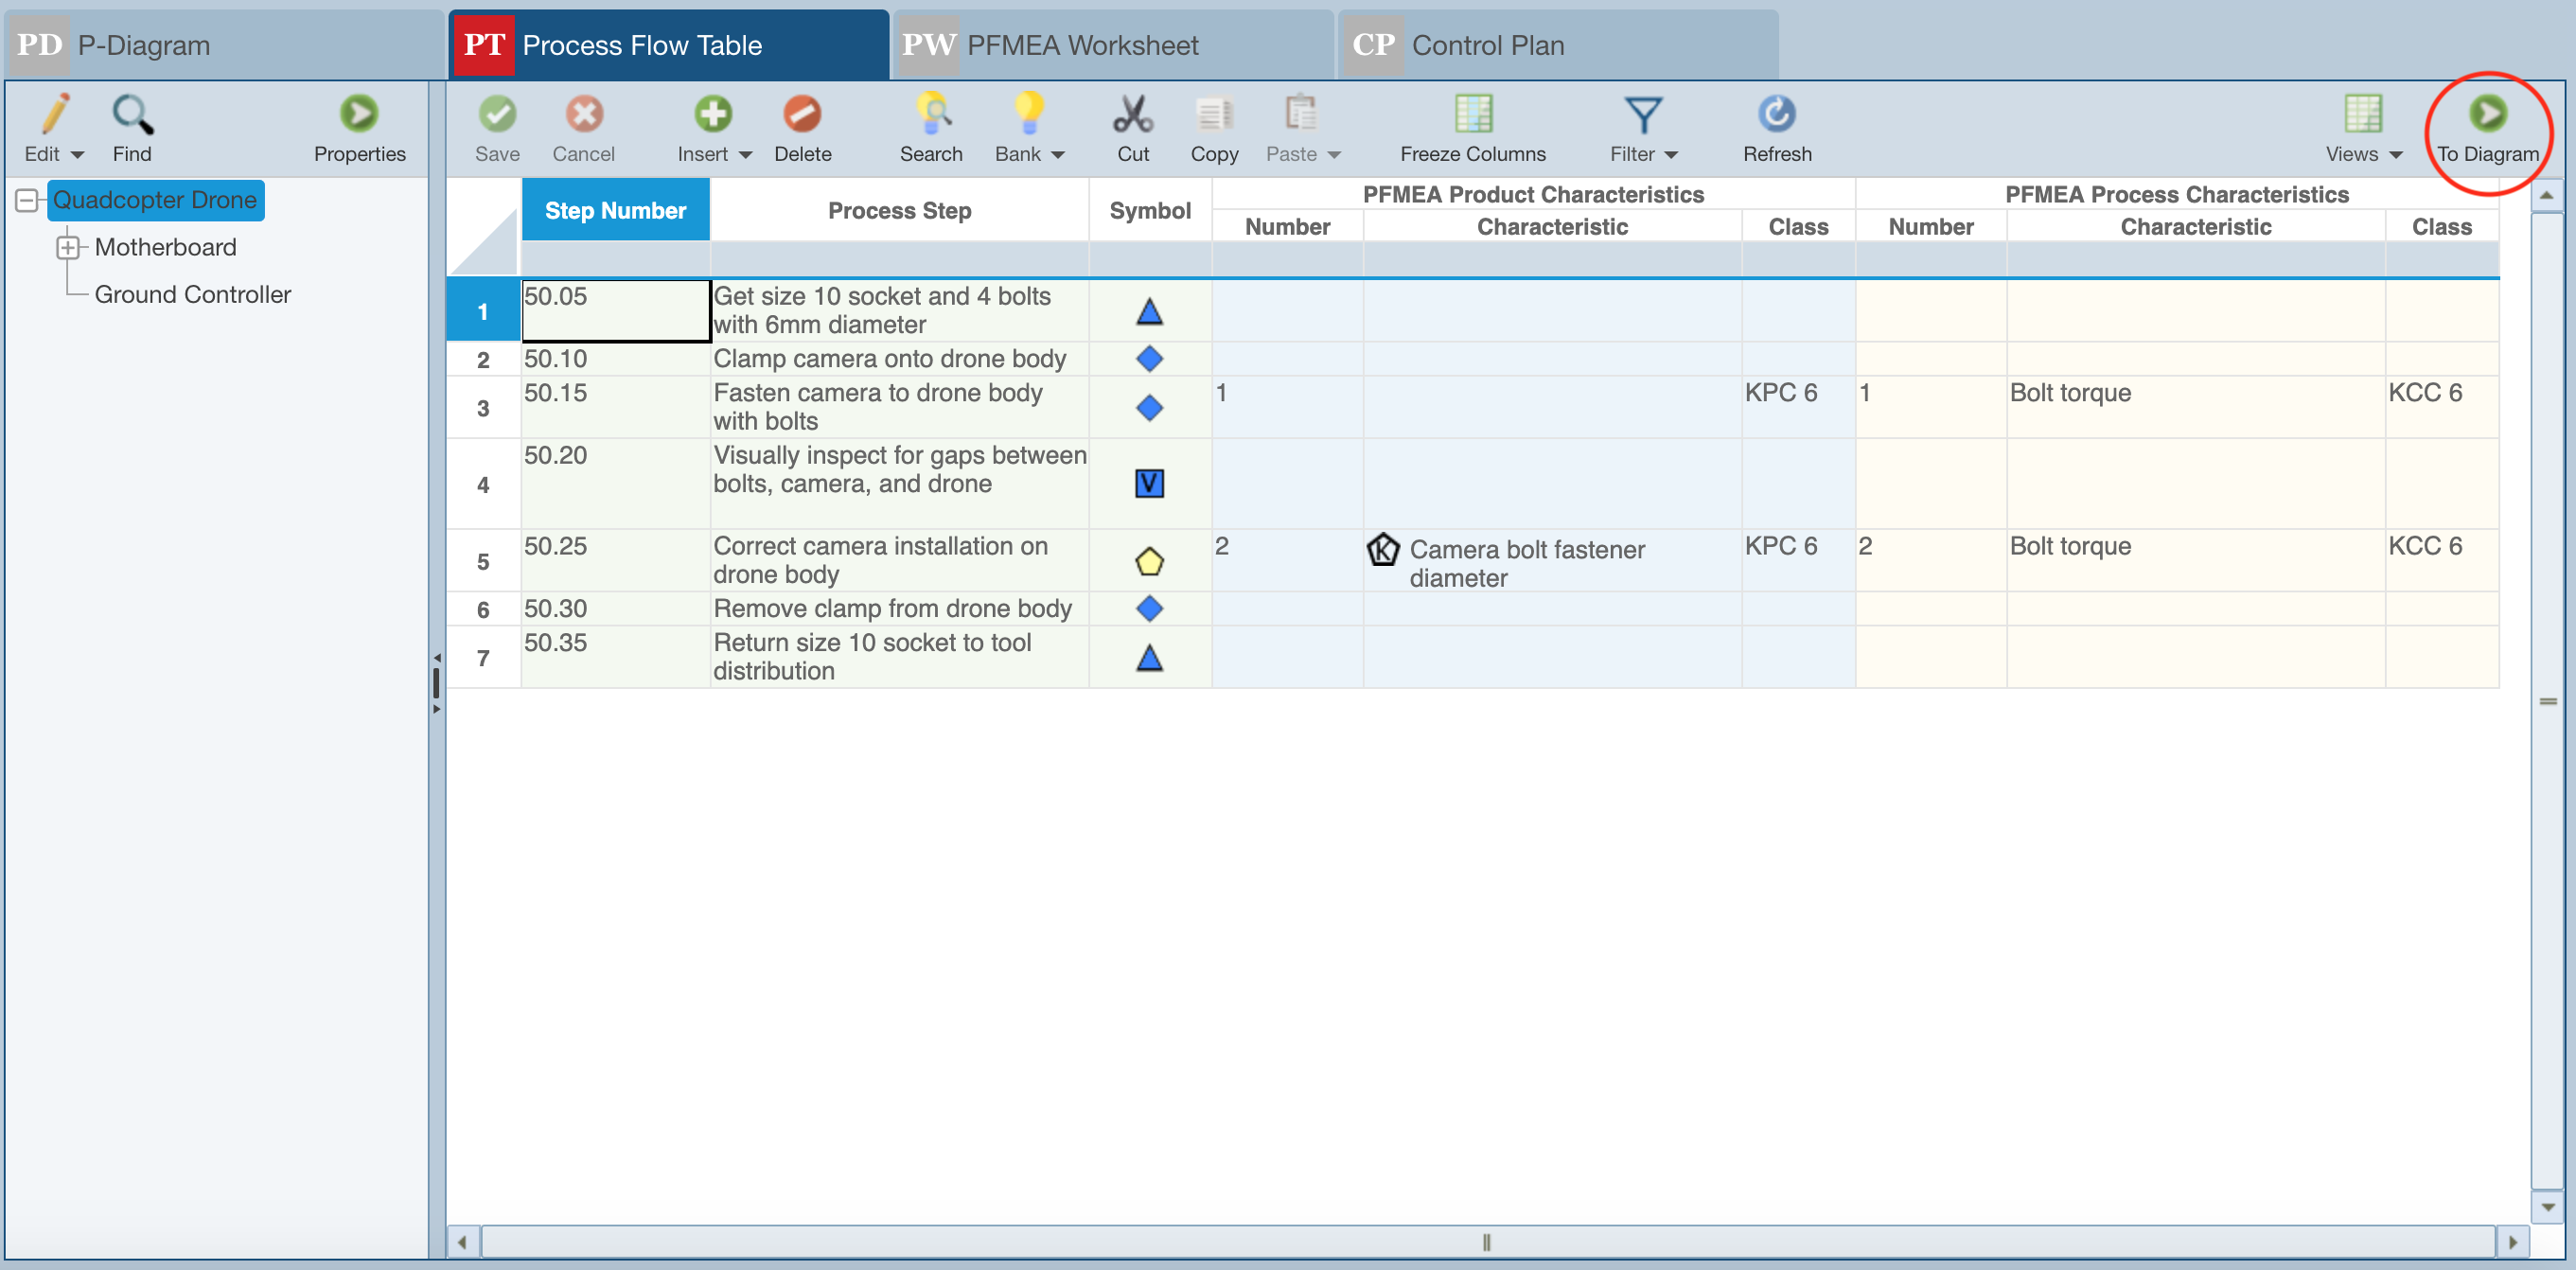
The Process Flow Diagram appears.
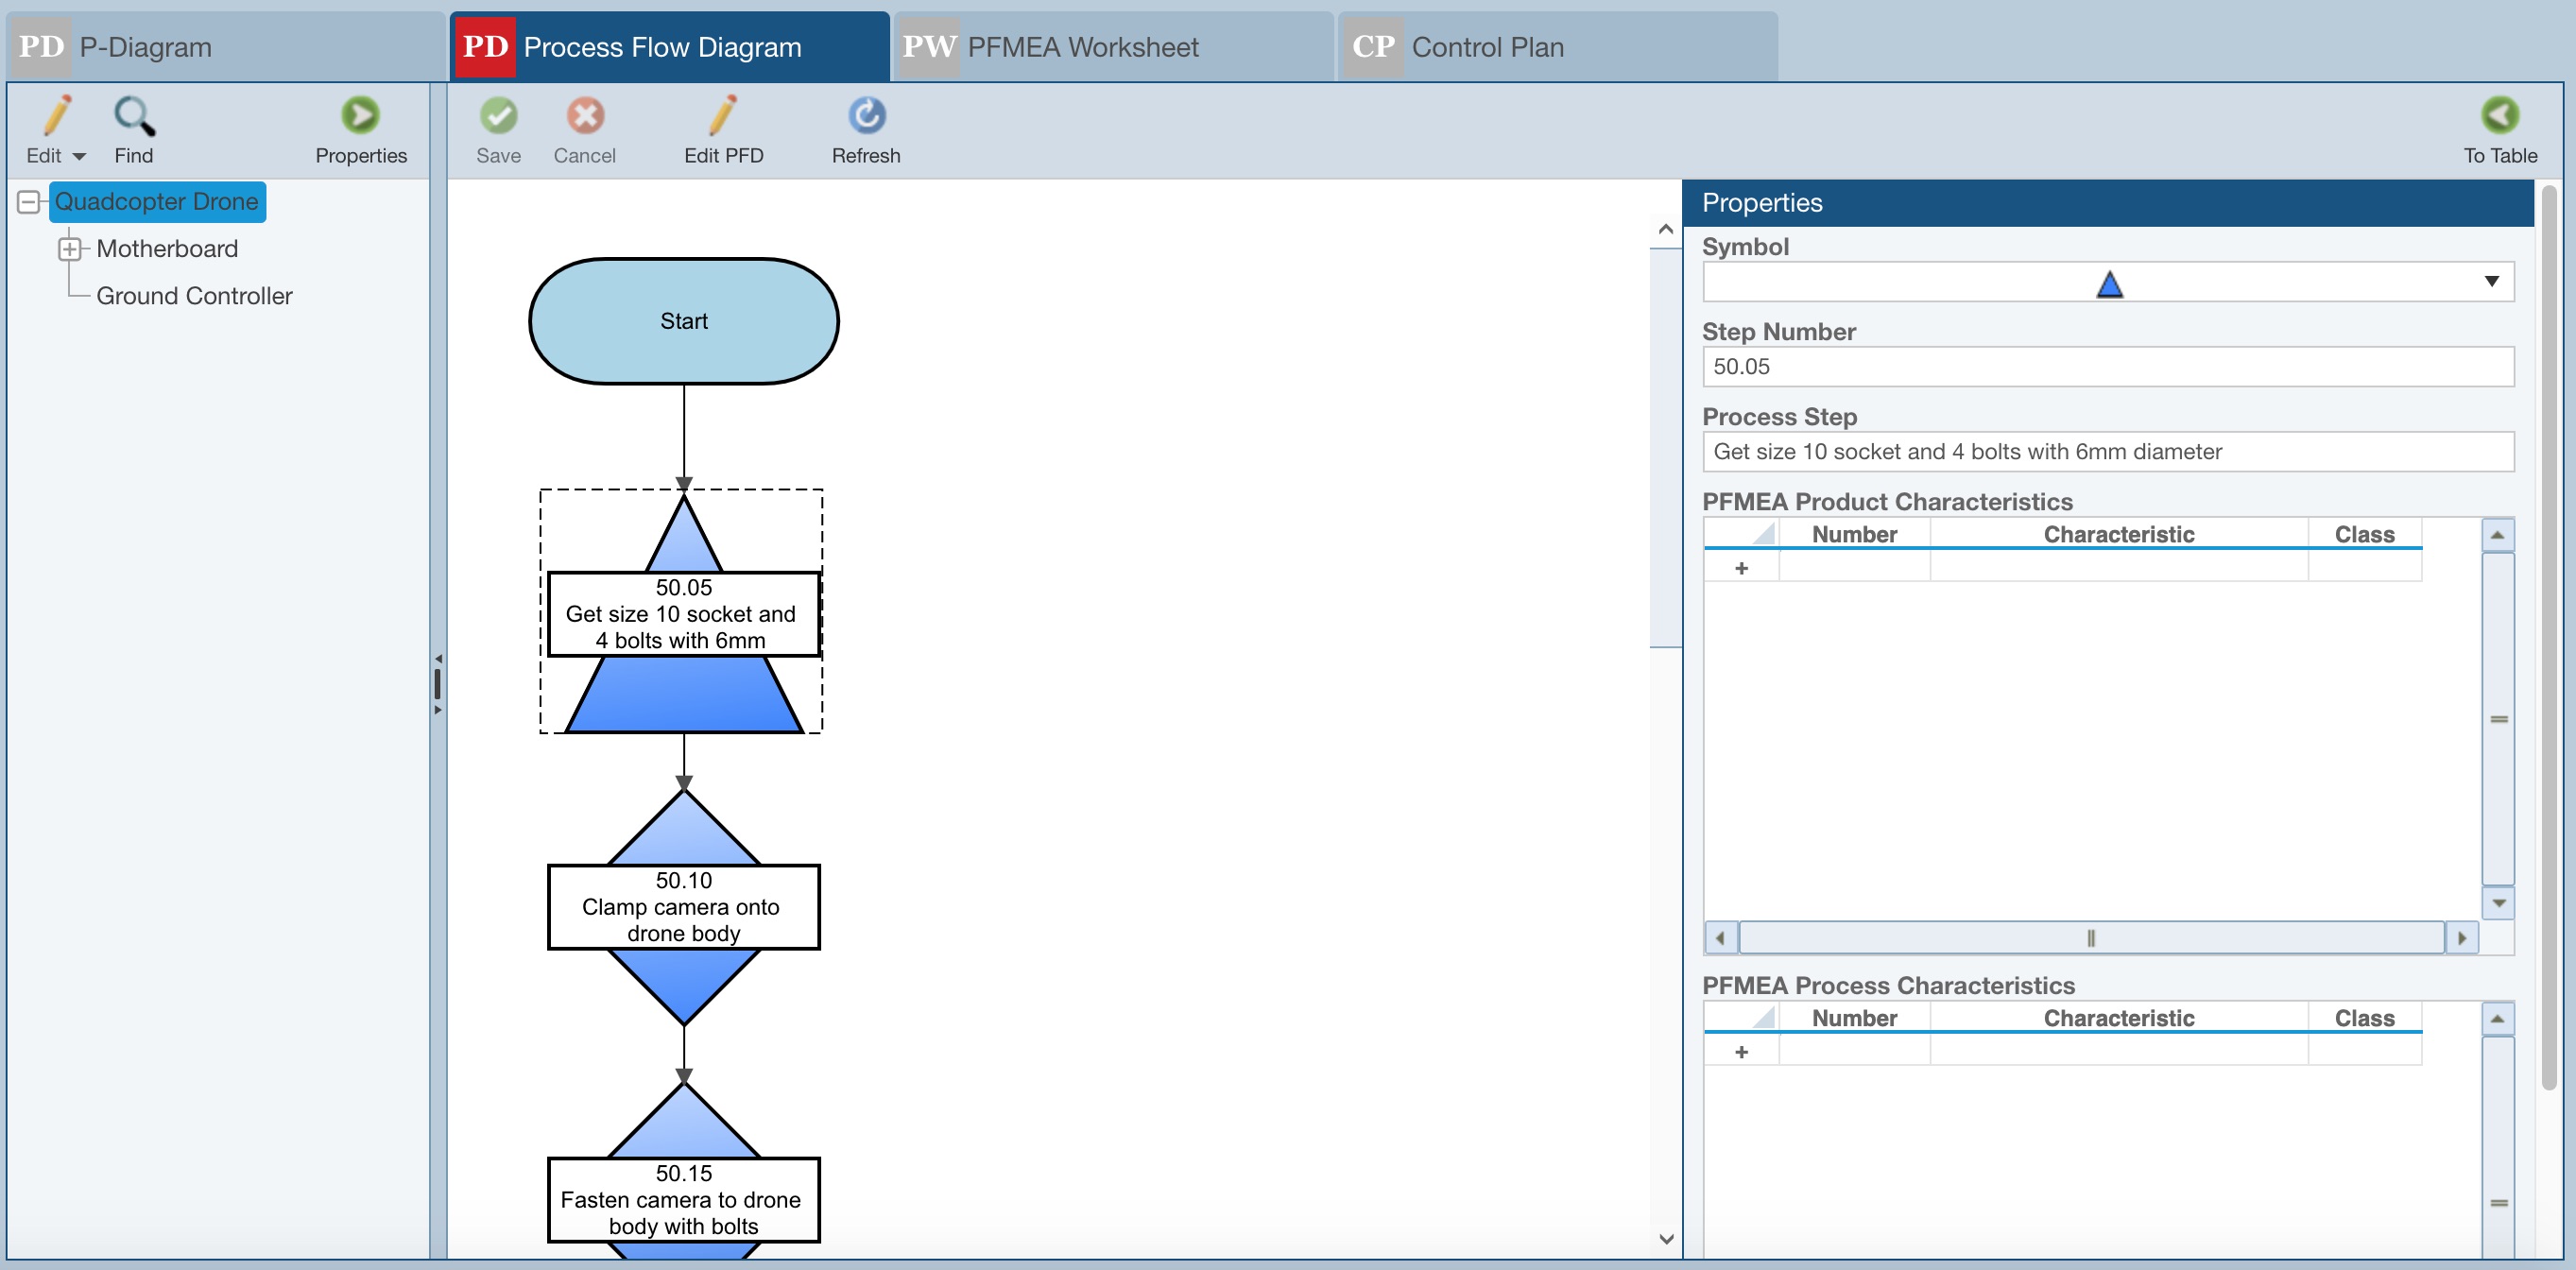
In the PFD, each step in your process is a block in the diagram. You can select each block and edit its associated properties. The data in the PFT and PFD are kept in sync so that modifications made in one view reflect in the other automatically.
In the PFD, you can edit the layout and connections of your diagram using the Diagram Editor by clicking Edit PFD in the toolbar.
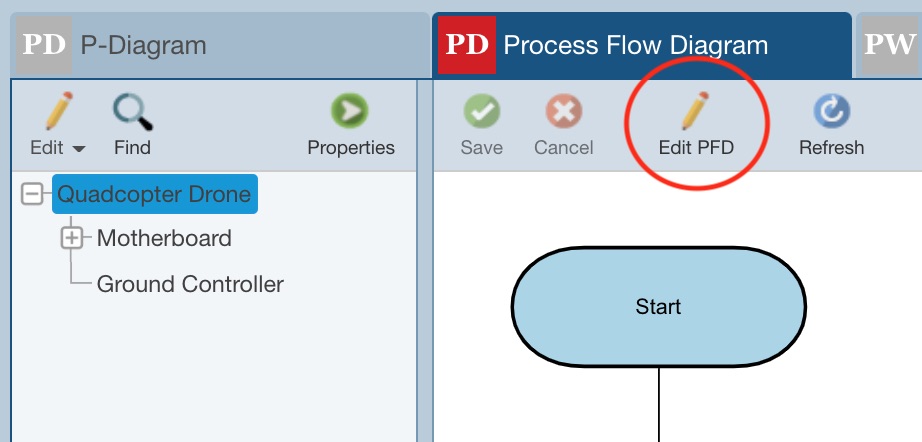
The Diagram Editor is activated to enable you to edit the PFD.
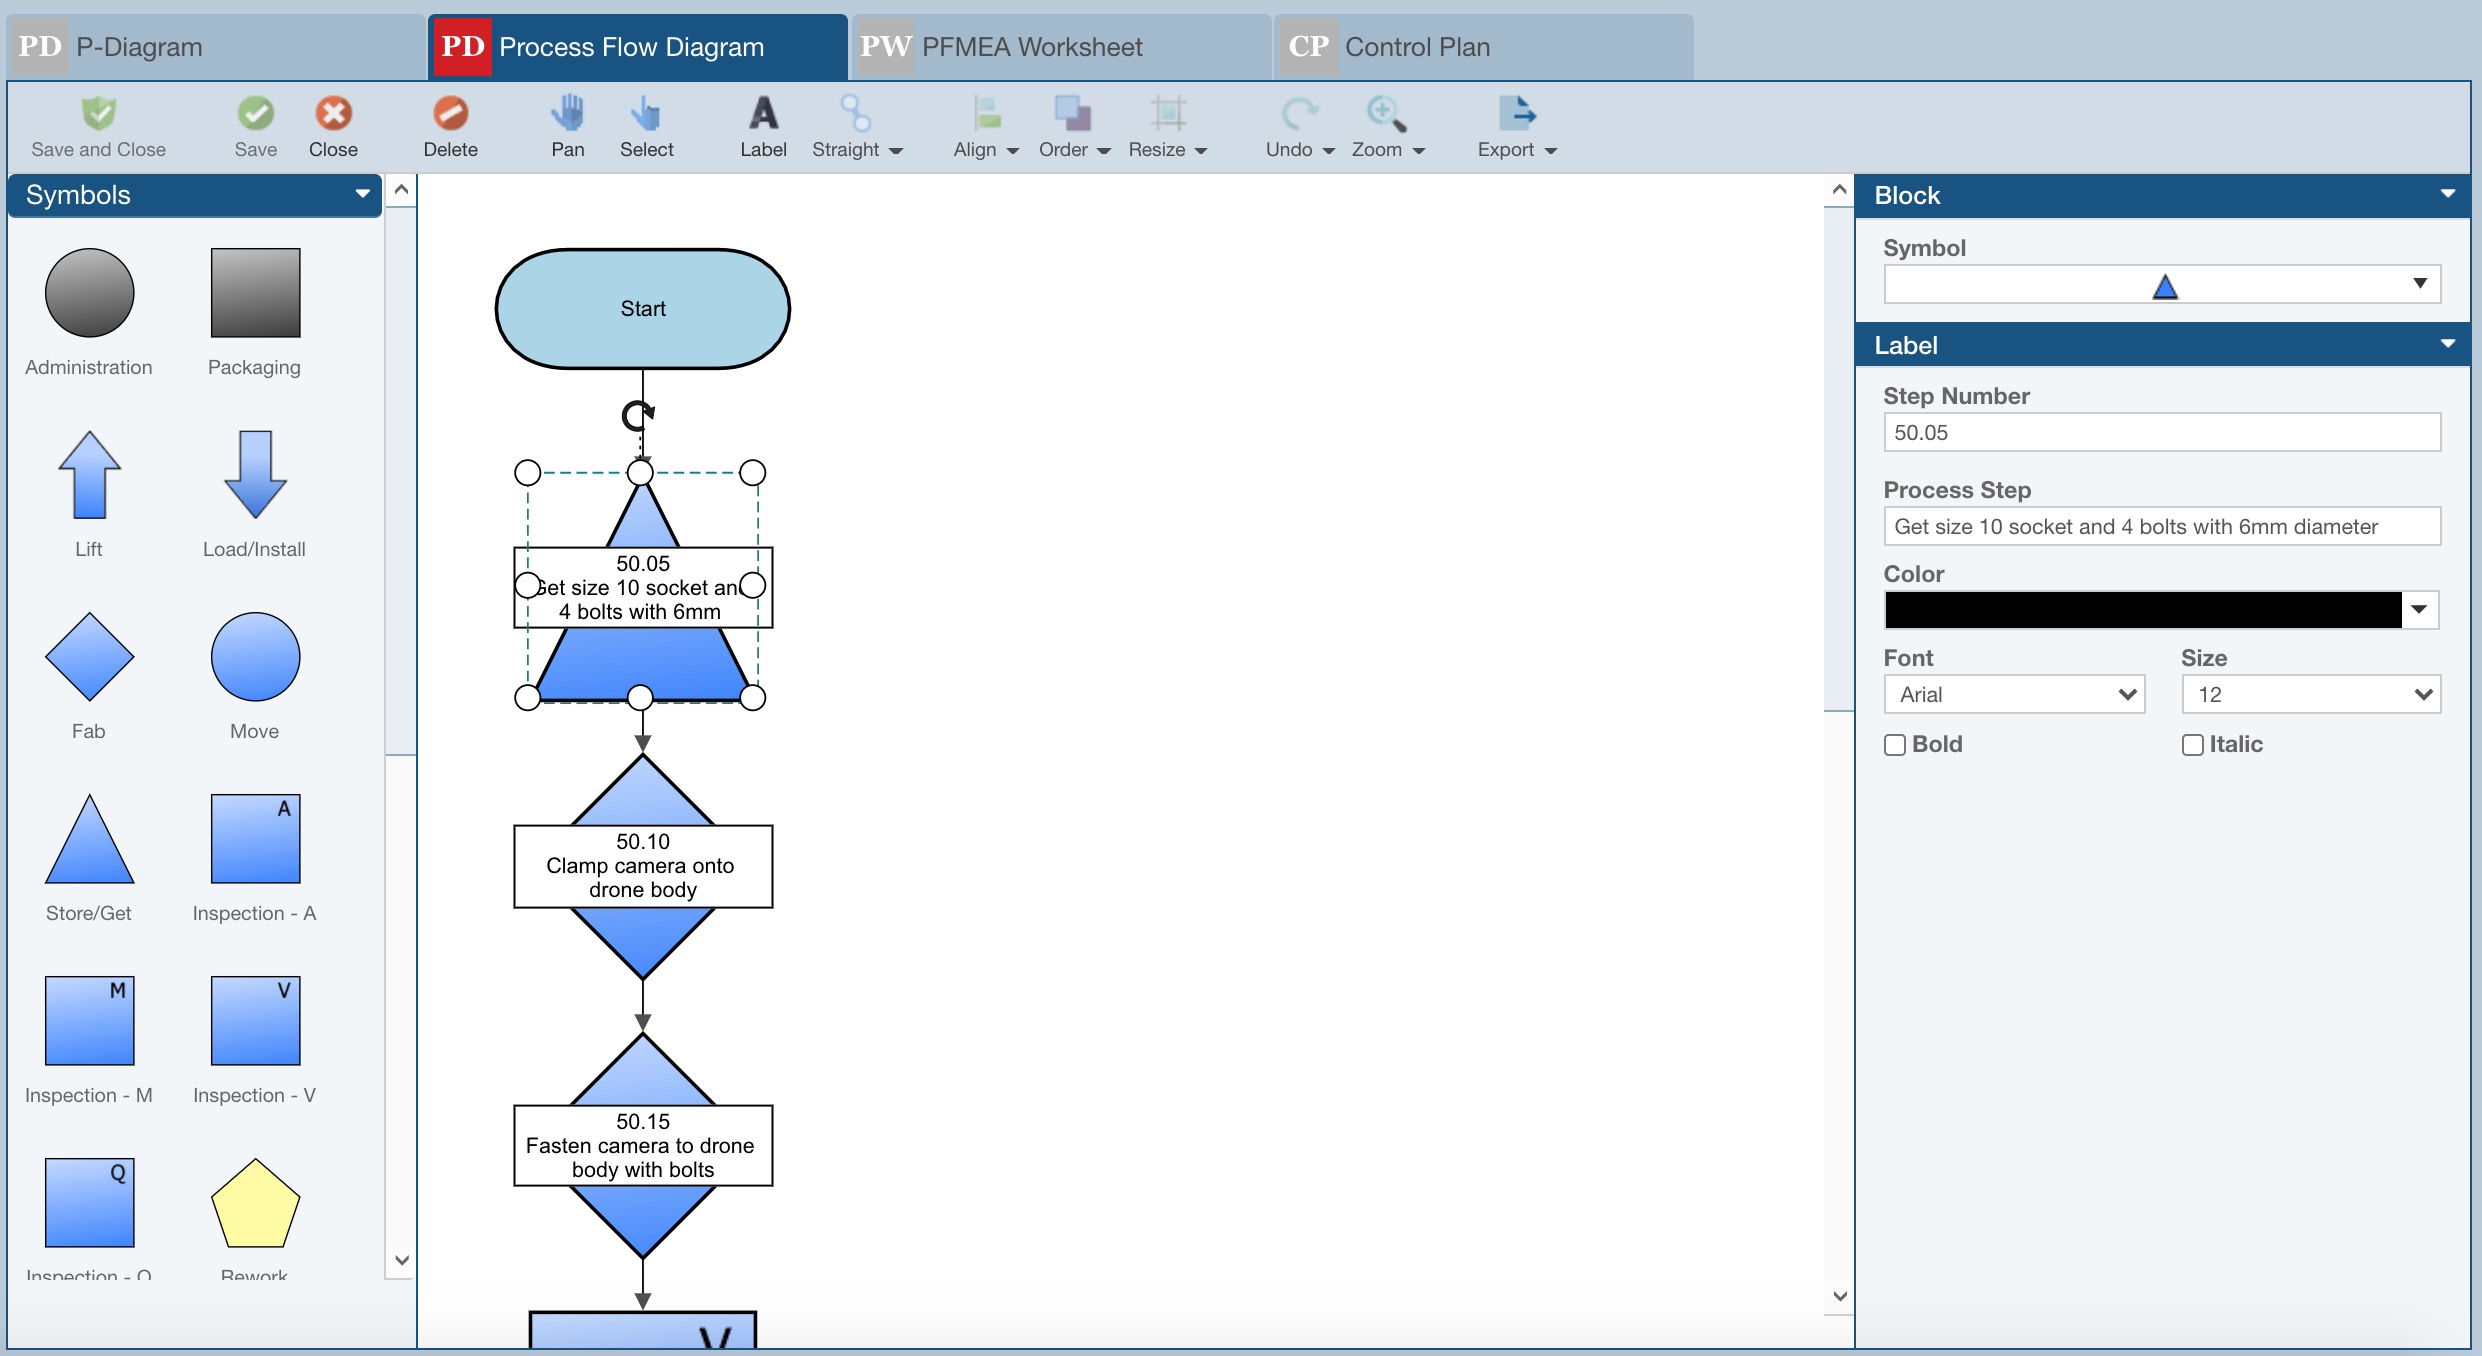
When in Edit mode, you can edit the visual properties and layout of your diagram. Using the Symbols or Flowchart pane on the left, you can drag and drop symbols onto your diagram. Each Symbol on your diagram represents a step in your process flow. Any Symbols (process steps) added in the diagram editor will appear in the PFT automatically.
Flowchart items can be added to your diagram to clarify your process if desired. Flowchart items will not appear in your PFT because they do not represent controlled process steps.
You can use the Properties pane on the right to change the visual properties of your diagram. When you have completed making your changes, click Save and Close to save your modifications and return to the diagram view.
For more details on using the diagram editor, see the Relyence Analysis Diagram section of this guide.
Step 4: Complete the PFMEA Worksheet
The PFMEA Worksheet is where you consider all potential failure modes, and their effect(s), cause(s), and recommended action(s). While P-Diagrams, the PFD, and Control Plans are optional for some organizations, the PFMEA Worksheet is used in almost all PFMEA processes.
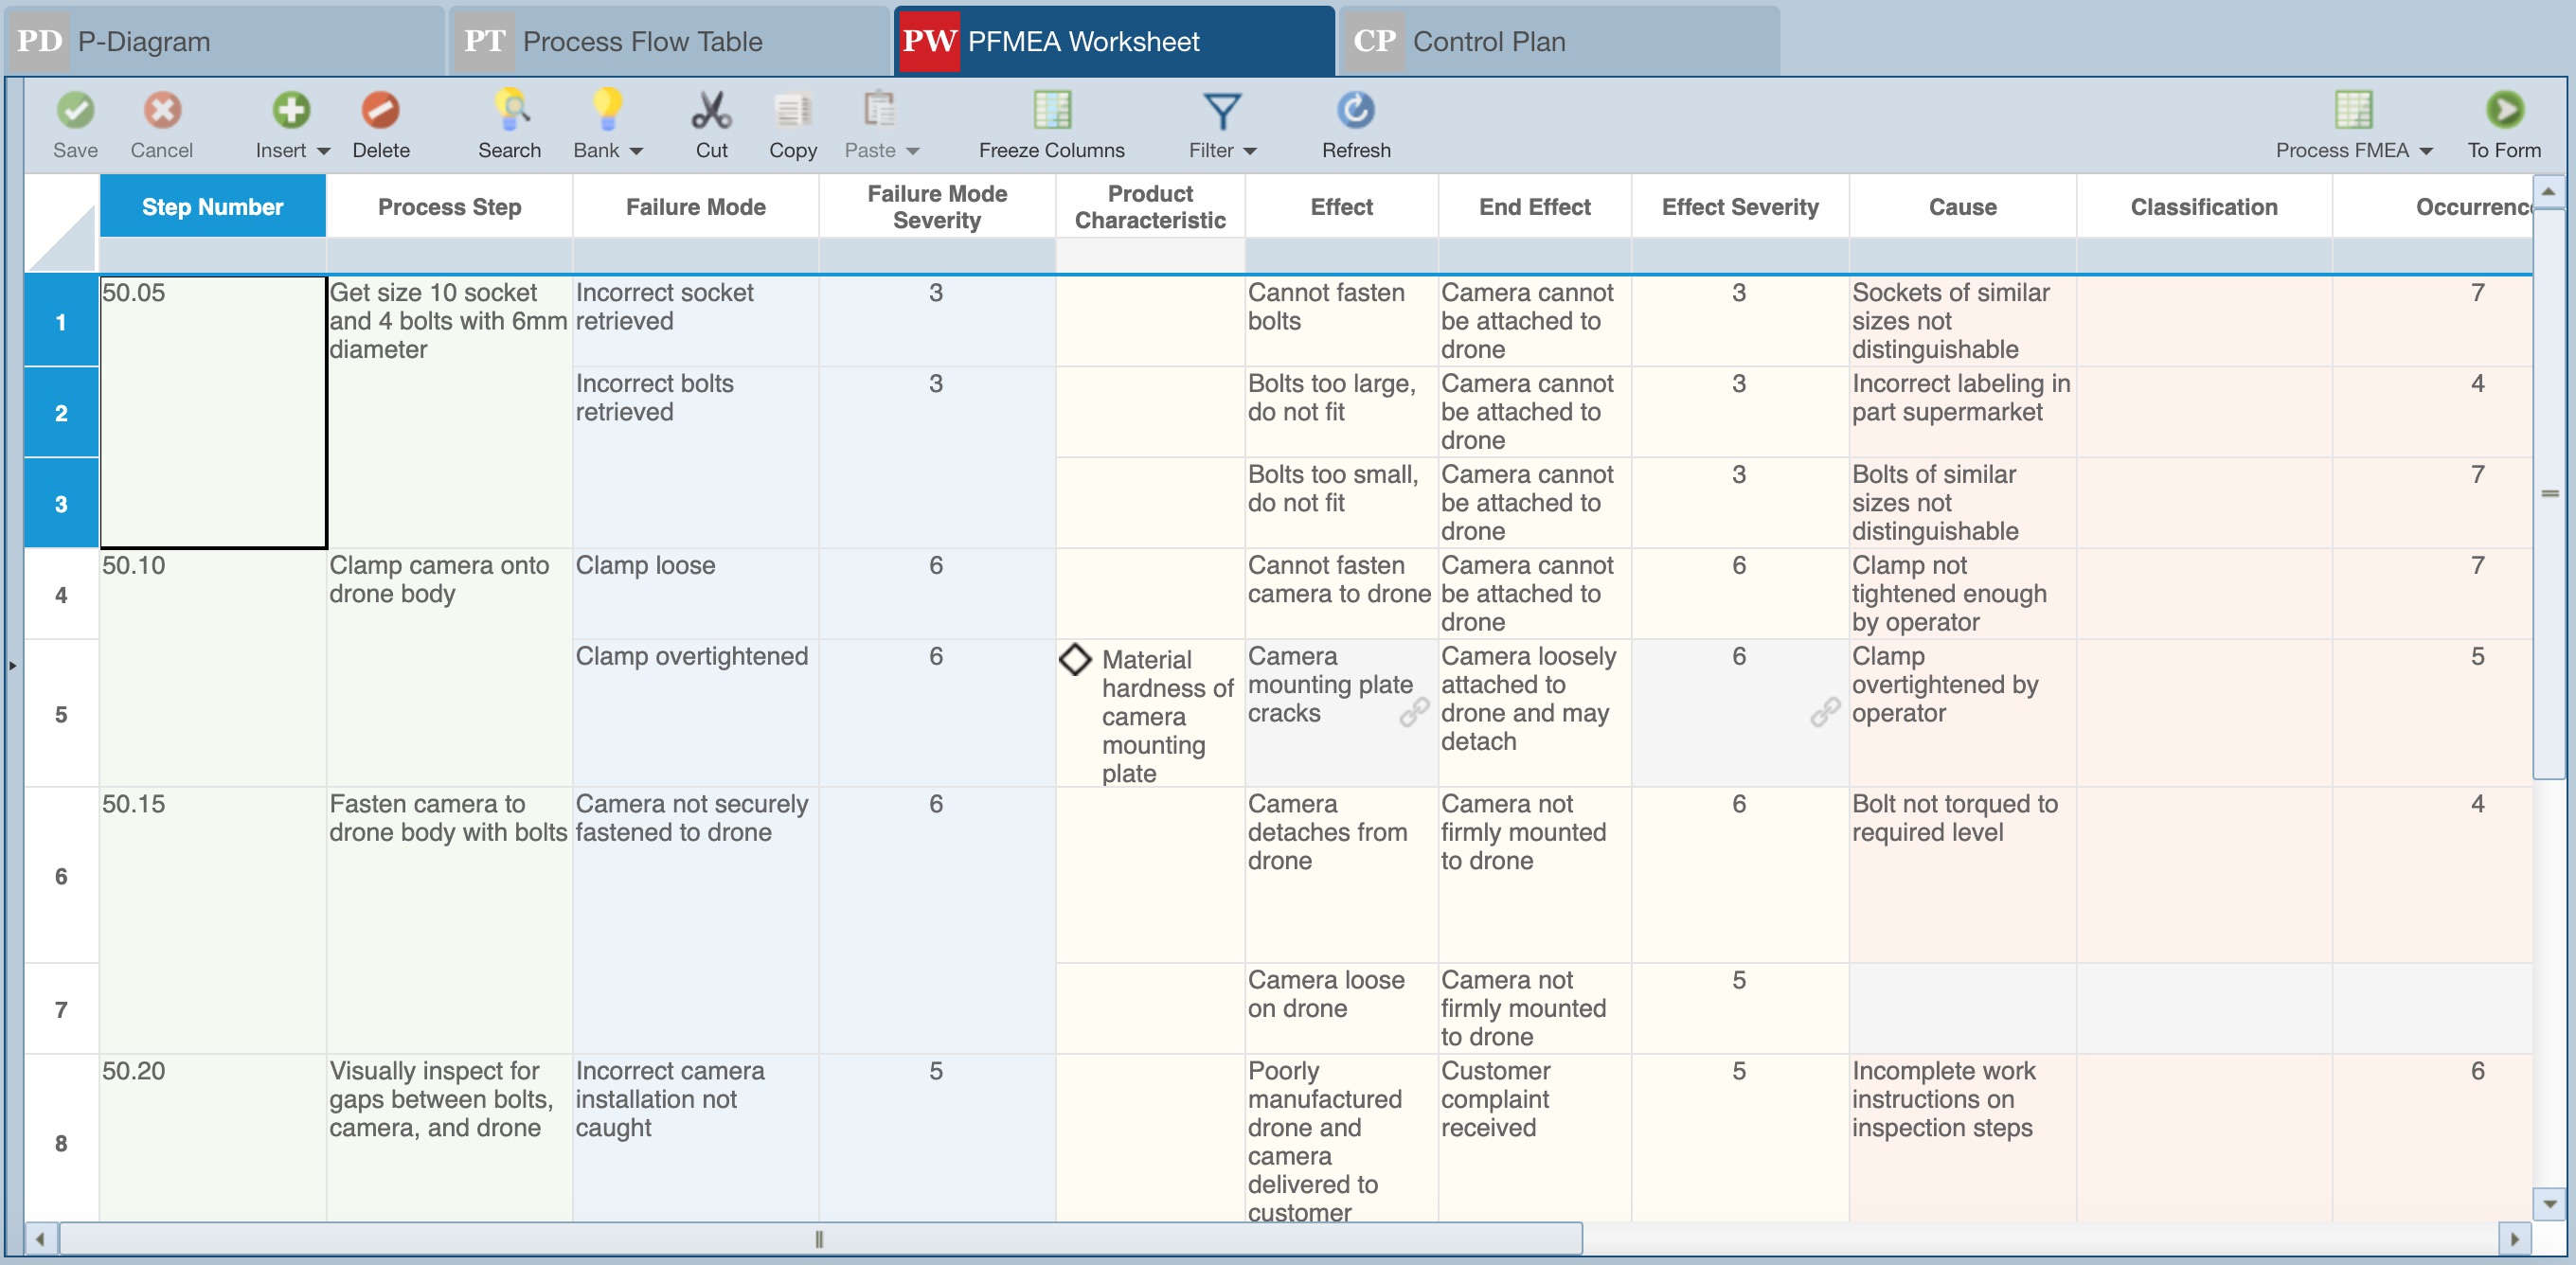
In Relyence FMEA, the Process Steps and Product Characteristics you have defined in your PFD are automatically entered into your PFMEA Worksheet. This means that you can enter your process steps in either place and they will automatically appear in the other. This ensures that your PFMEA information remains in sync.
If you prefer, you can directly enter your process steps in the PFMEA Worksheet. Relyence FMEA will automatically add them to the corresponding PFD and CP.
Using the process steps as a starting point, you can now begin the PFMEA work. The following steps are used to complete your PFMEA:
Note: It is from the Insert button that you can add Process Steps, Failure Modes, Effects, Causes, Actions, as well as FRACAS Failure Data and P-Diagram Data. Relyence FMEA also offers Autoflow functionality which allows you to define criteria to allow for records to be created and/or data fields to be populated. For more details about Autoflow in Relyence FMEA, see the FMEA Data Autoflow topic.
- For each step in the process, identify all the potential failure modes.
- For each failure mode, assign a severity ranking. If you leave the Failure Mode Severity blank, Relyence FMEA will automatically assign the maximum severity level of all the effect severities for this failure mode.
- For each failure mode, enter the effects of failure. There may be more than one effect. The effect may automatically be assigned by selecting an applicable Product Characteristic.
- If a specific failure mode is associated with a Product Characteristic, designate it in your Worksheet. The Product Characteristics from your PFD will automatically be entered in initially to use as a starting point. For each new failure mode you add, you can select an associated Product Characteristic, if desired. You can also add new Product Characteristics. Newly added Product Characteristics will automatically be added to the Product Characteristics table; for more details, see the Using Product Characteristics.
- For each effect, assign a severity if desired. You are not required to enter a severity for each effect, or for any of the effects, instead you can just enter the failure mode severity. In order to compute a Risk Priority Number (RPN), you must enter a severity value at either the effect or the failure mode level. Note that if the Effect Severity field is read-only and shows a link symbol, its value is assigned based on the assigned Product Characteristic.
- For each failure mode, list out the possible causes. There may be more than one cause.
- If a Key Product Characteristic (KPC) is associated with a cause, designate it in your Worksheet.
- For each cause, assign an occurrence ranking. Occurrence ranking indicates the frequency that this cause occurs.
- For each cause, assign a detection ranking. Detection ranking indicators how detectable the given cause is.
- Relyence FMEA will automatically compute the Risk Priority Number (RPN) value.
- Using the RPN values as a basis, develop an action plan. Your action plan defines which line items in your PFMEA you want to work on to either mitigate or eliminate in order to maintain your quality objectives.
- Define your recommended actions in your PFMEA Worksheet.
- Assign actions to team members to implement.
- Once actions have been completed, go back and determine the revised severity, revised occurrence, and revised detection values based on the actions taken.
- Relyence FMEA will automatically compute the revised RPN values.
- Continue to update and rework your PFMEA until you are confident all your high priority issues have been addressed.
The final step in your PFMEA may be to create a Control Plan, or CP. The process steps are used as the starting point for your CP. Again, remember that your process steps can be entered in either the PFD or PFT, your PFMEA Worksheet, or directly into your CP. Wherever you enter process step numbers and descriptions, they are automatically kept in sync across the three main elements of your PFMEA.
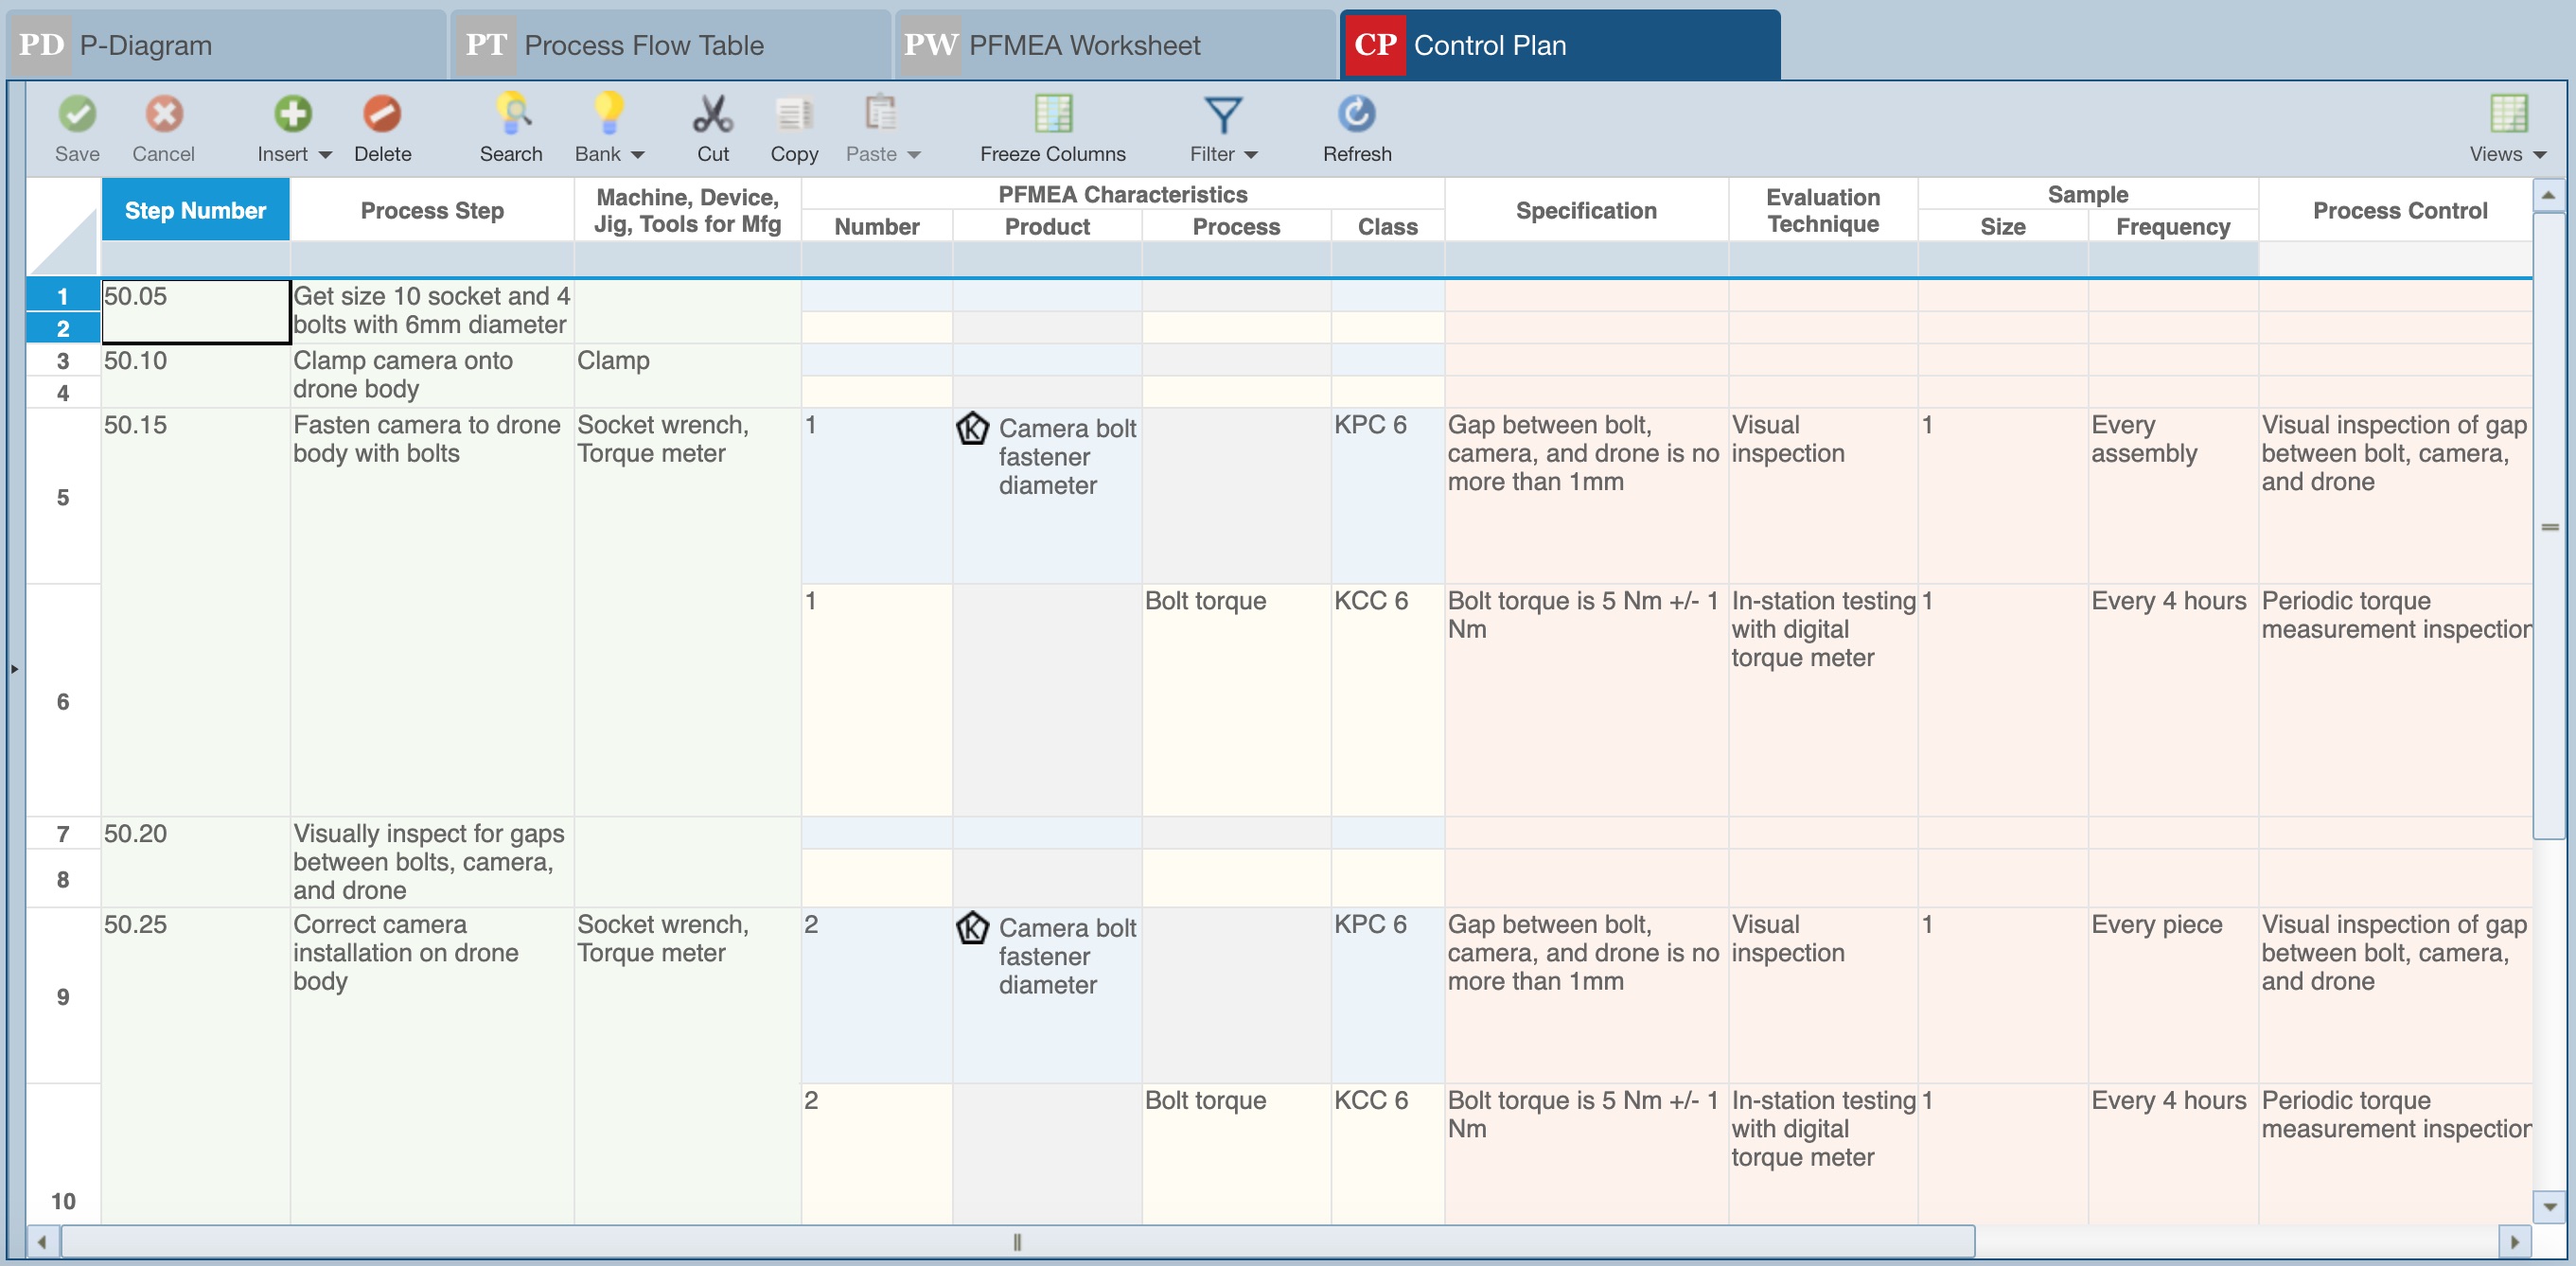
Using the process steps as a starting point, you can now complete the Control Plan. The following steps are used to complete your CP:
Note: It is from the Insert button that you can add Process Steps, Product Characteristics, Process Characteristics, and Controls.
- For each step in the process, review all PFMEA Product Characteristics and PFMEA Process Characteristics that may have been entered in the PFD/PFT. If needed, add additional PFMEA Product Characteristics and/or PFMEA Process Characteristics using Insert>Product Characteristic or Insert>Process Characteristic from the toolbar.
- For each characteristic, add necessary Controls and relevant data including the specification to be used as the basis for your Control, and details like sample size and frequency, the control method to employ, and the reaction plan to use if the item does not meet specifications.
- Revise the Control Plan as needed and utilize the details to help define documents such as operator instructions.